Monitor & Troubleshoot Meraki Switches
Sections:
Resources:
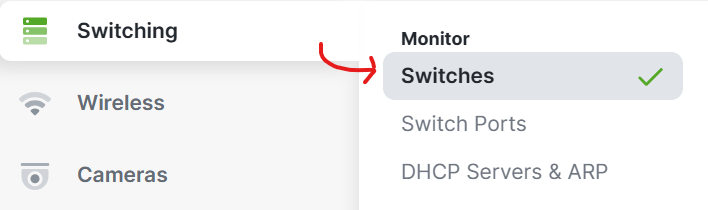
- Switches Page
- Switchports Page
- DHCP Servers & ARP Page
Overview:
- The monitoring section of Meraki switches from the Meraki Dashboard is designed to provide real-time and histrorical visibility into the performance, health, and status of your switches and their connected devices
- It is a central hub for tracking various network metrics and diagnosing potential issues
- The following pages allow admins to monitor and configure several important parameters to ensure the smooth operation of the network
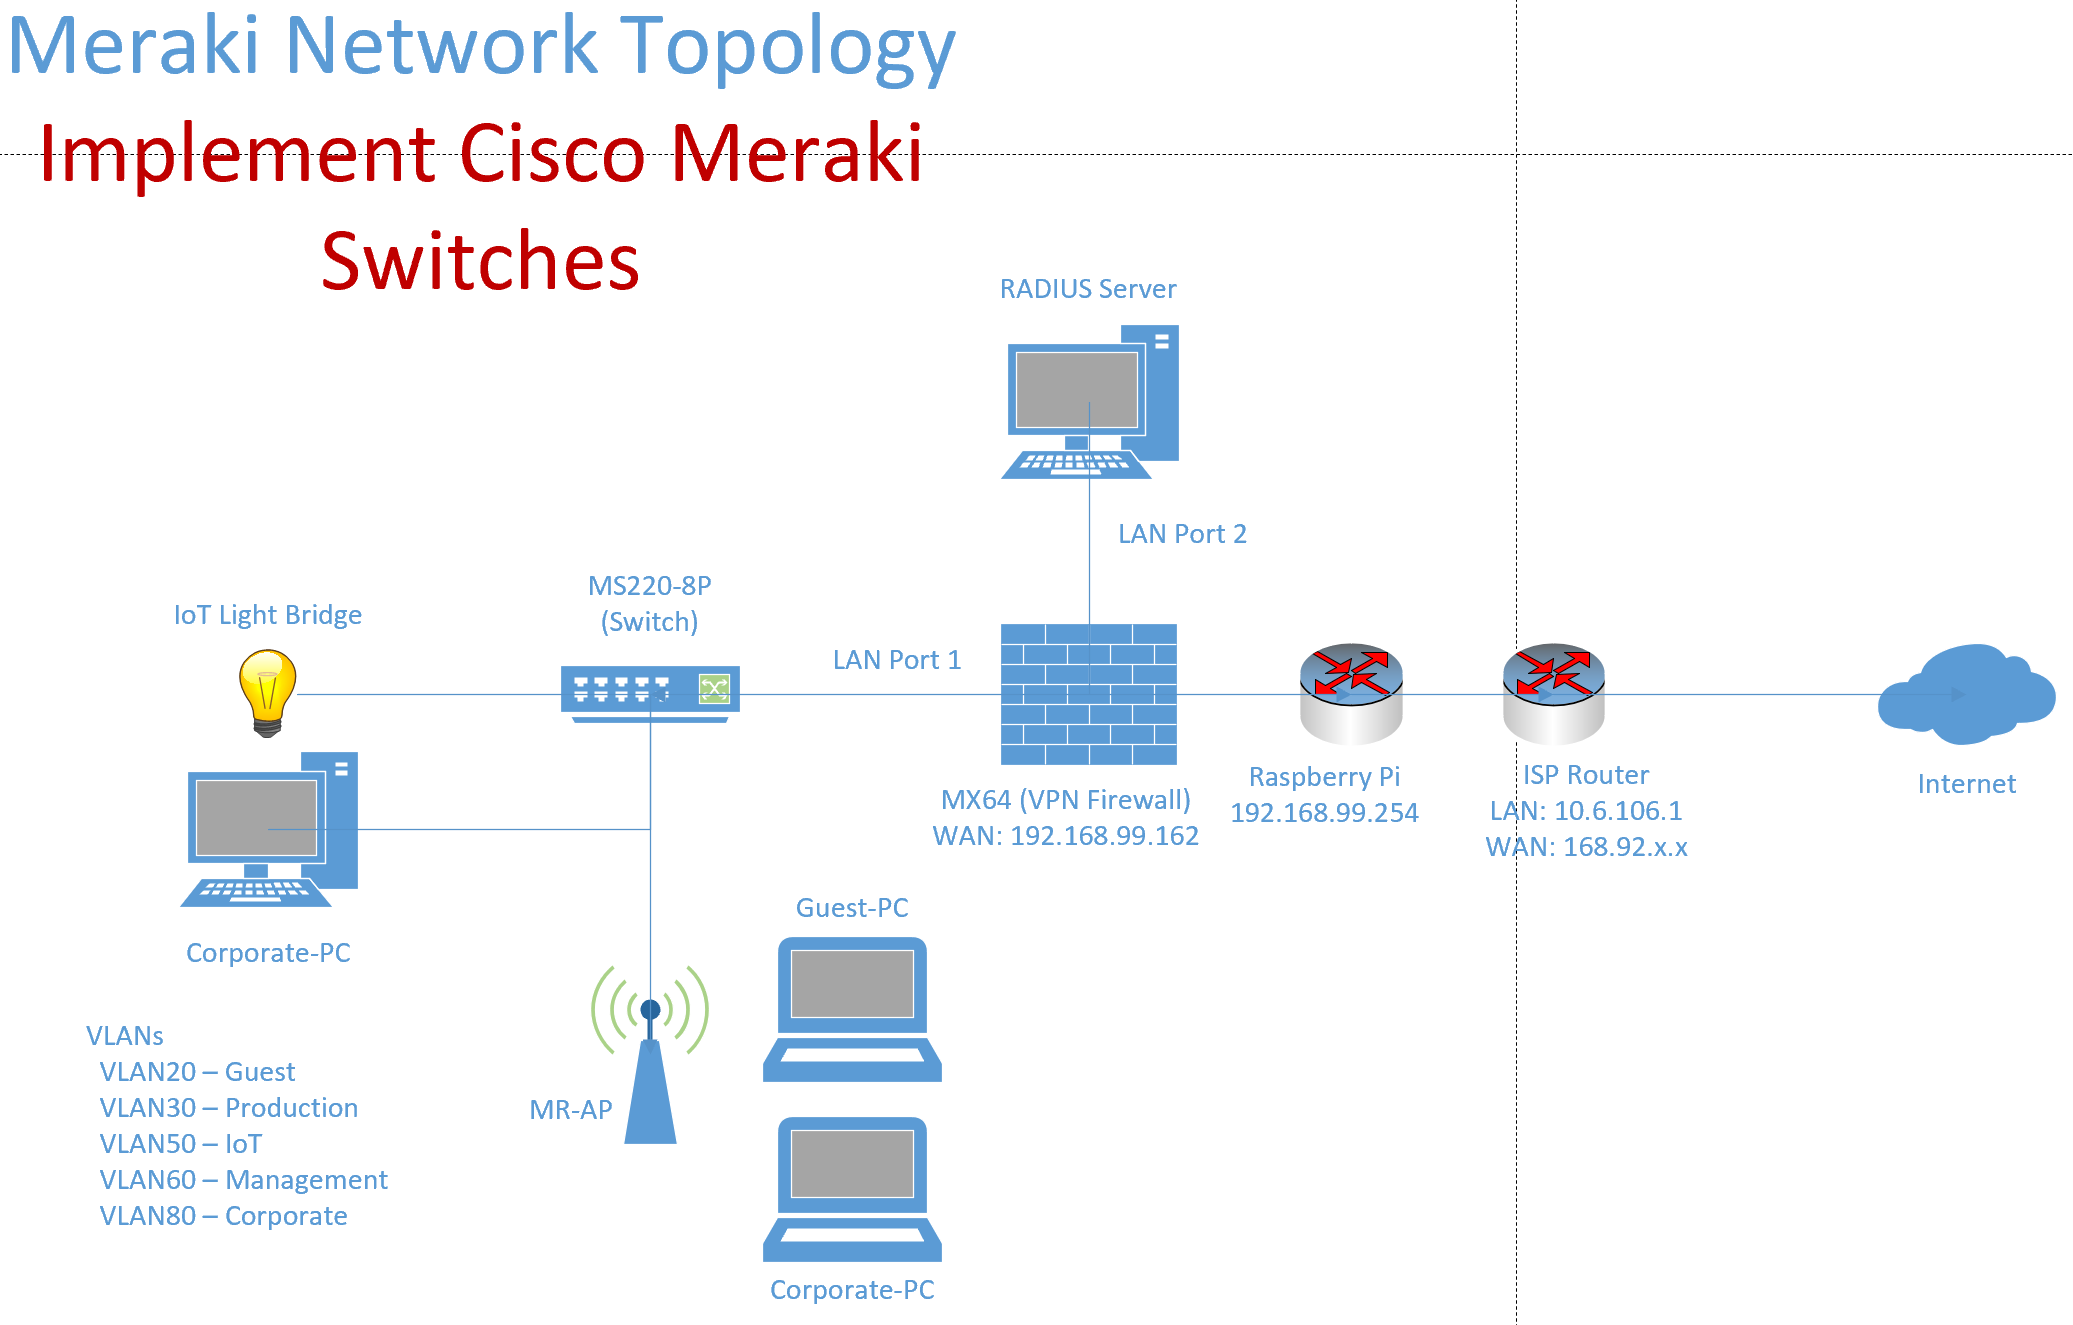
Lab Topology
Monitoring Switches: Summary
Overview:
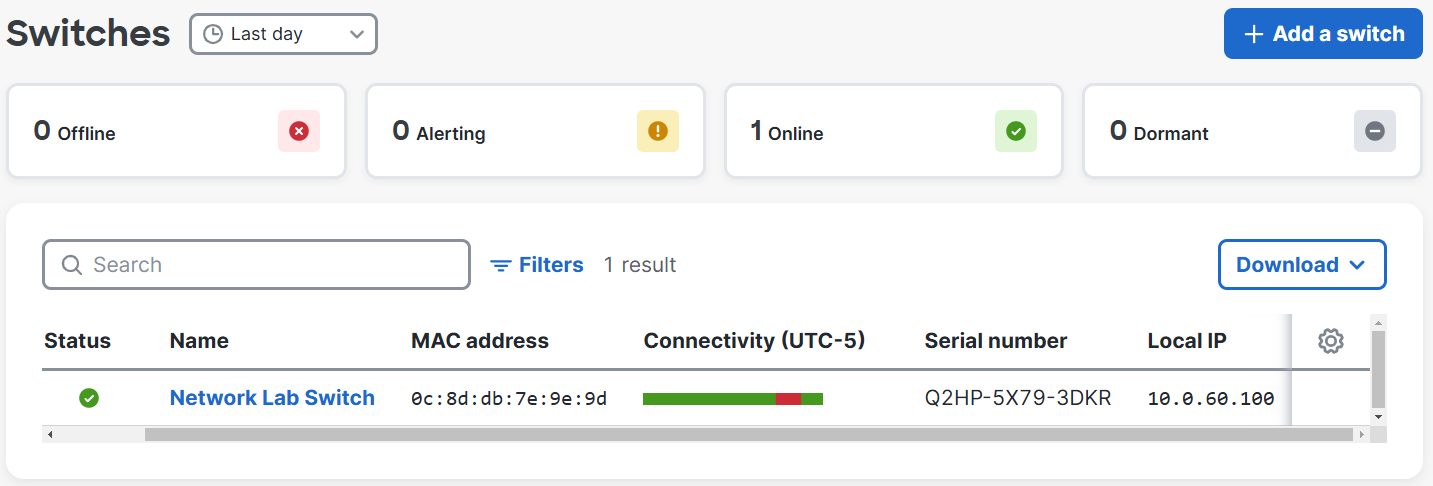
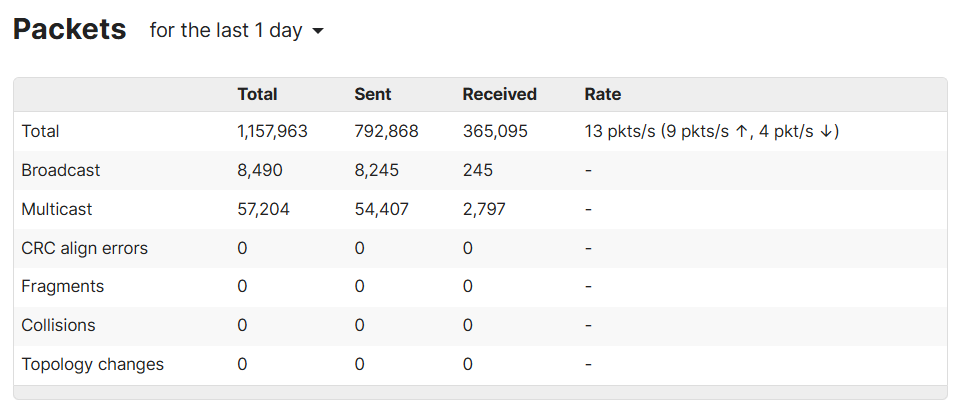
- The monitoring Switches Summary page is a dashboard view that provides an overview of key statistics and information related to a Meraki switch or group of switches in a network
- The Summary view is part of the Meraki dashboard allowing admins to get a summarized real time and historical view of the network's health and performance presenting quicker troubleshooting and proactive maintenance
Monitoring Switches Menu
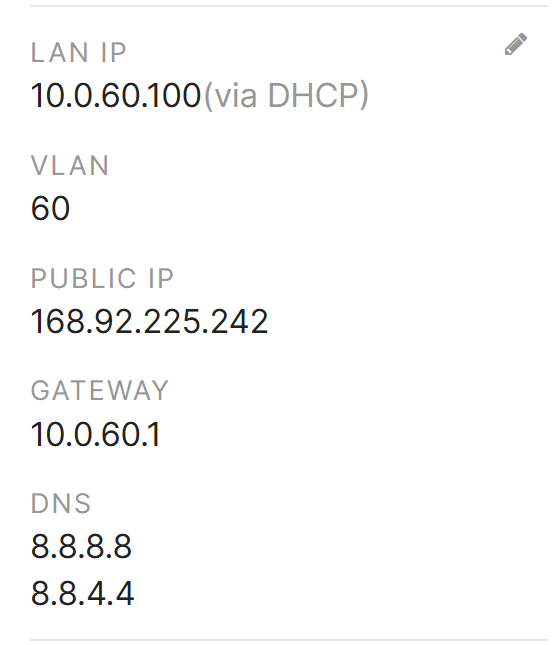
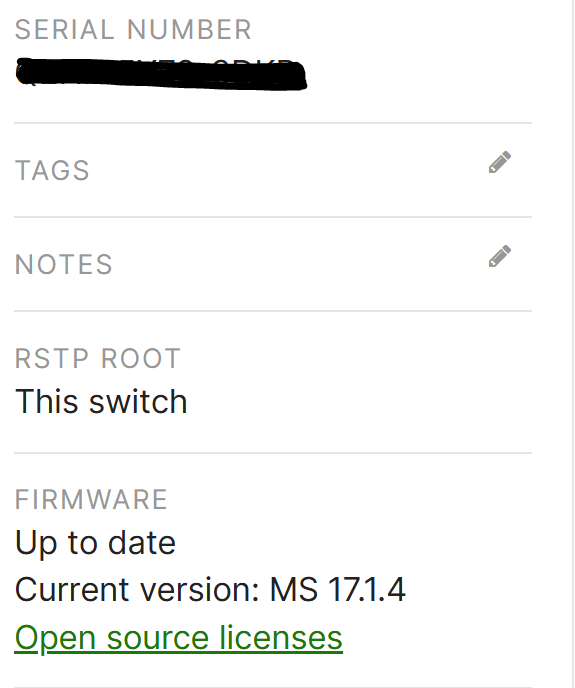
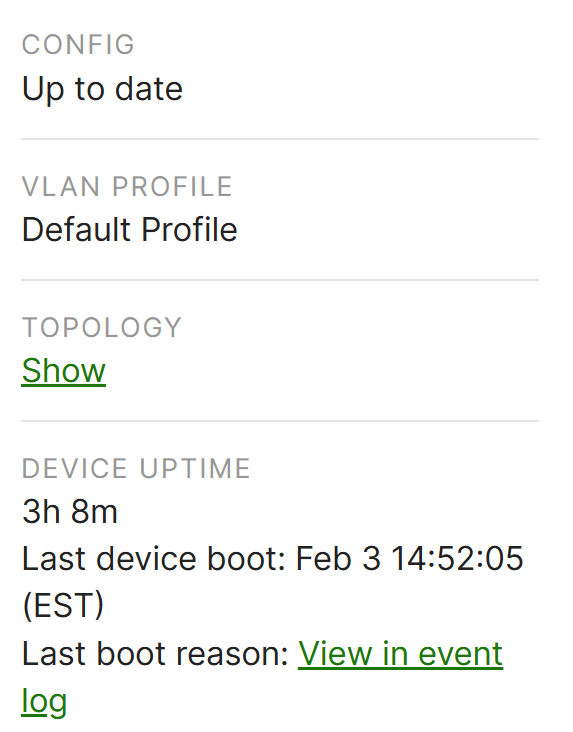
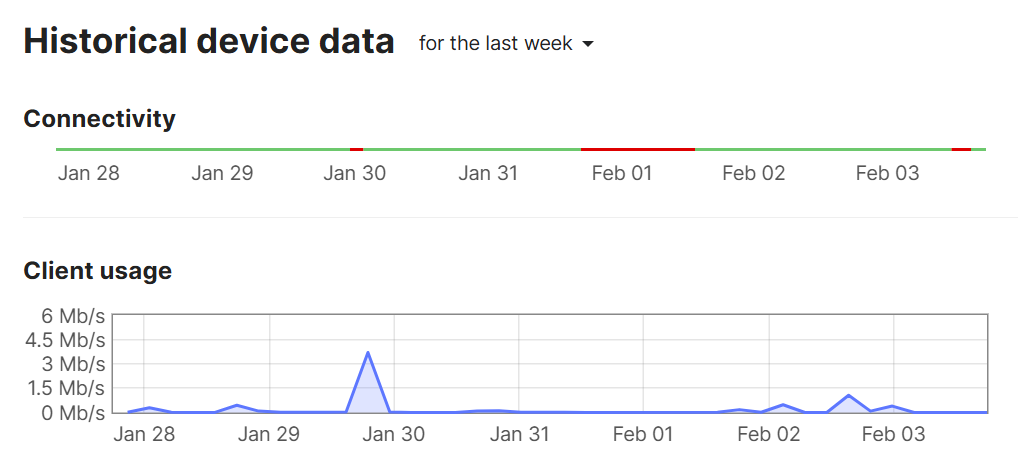
Summary Menu Overview:

Monitoring Switches: Ports
Overview:
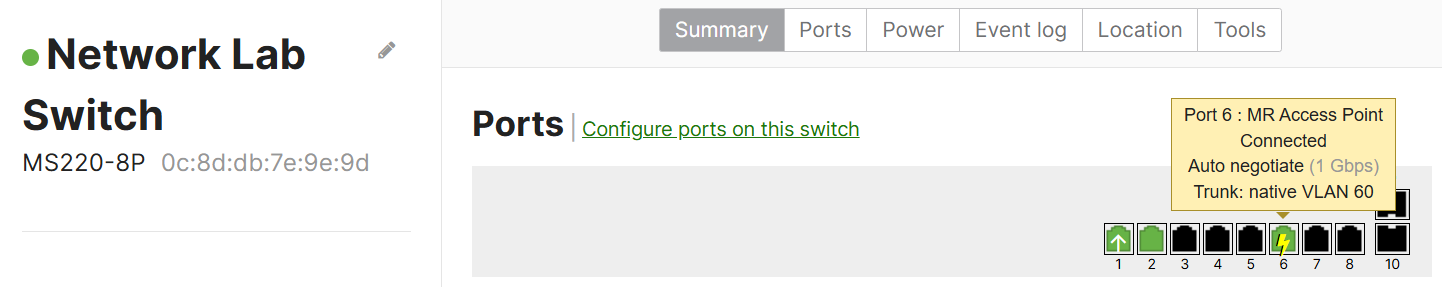
- The monitoring Switches Ports page provides a detailed view of all the individual switch ports, allowing admins to monitor and manage each port on a Meraki switch
- This page offers valuable insights into the performance, configuration, and status of each switchport
- If you're managing a Meraki switch and notice one port has unusually high traffic or errors, this page will allow you to investigate the specific port, check its configuration, and see the devices connected to it. You can then troubleshoot further by adjusting settings, reconfiguring VLANs, or checking the connected devices for issues
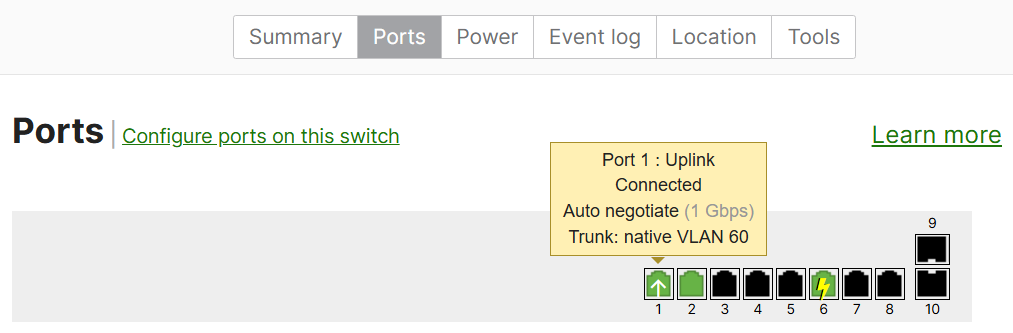
Ports Menu Overview:
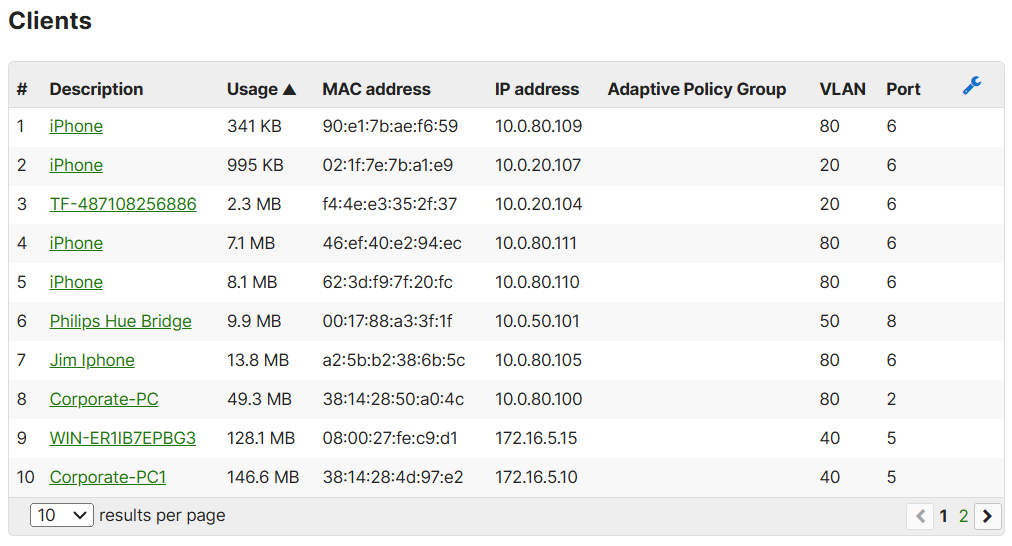
Quick Snapshot of Port Statistics
Overview of all Switchport Configurations
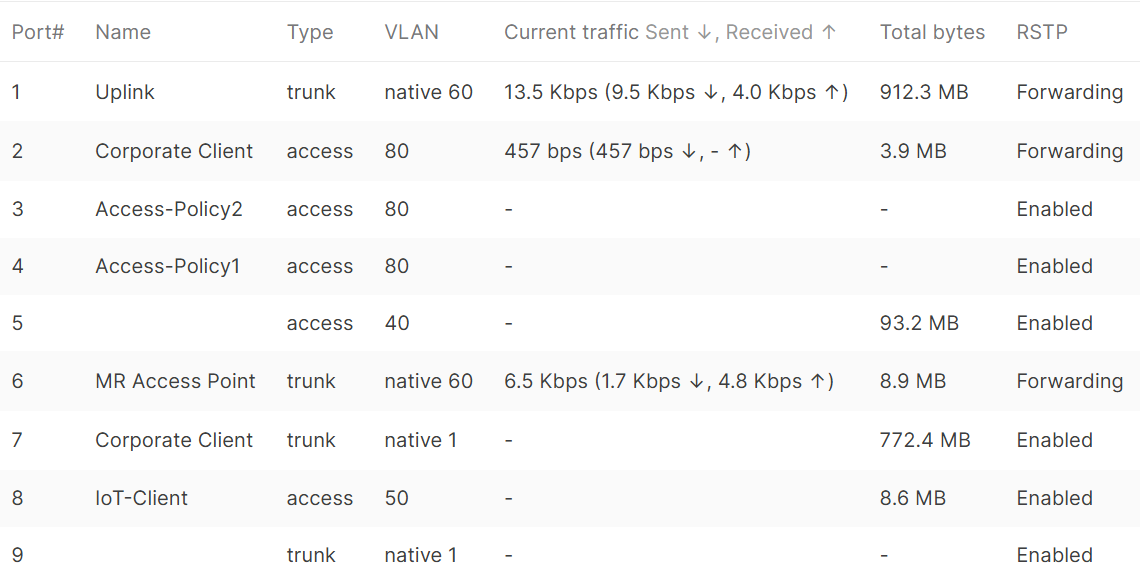
Overview of all Switchport Configurations
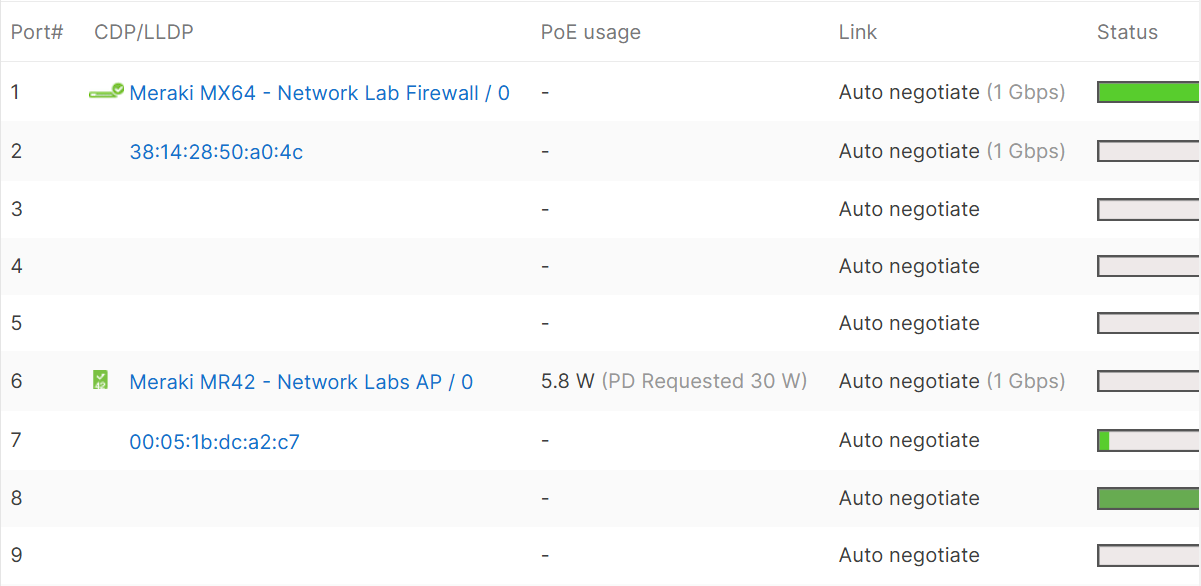
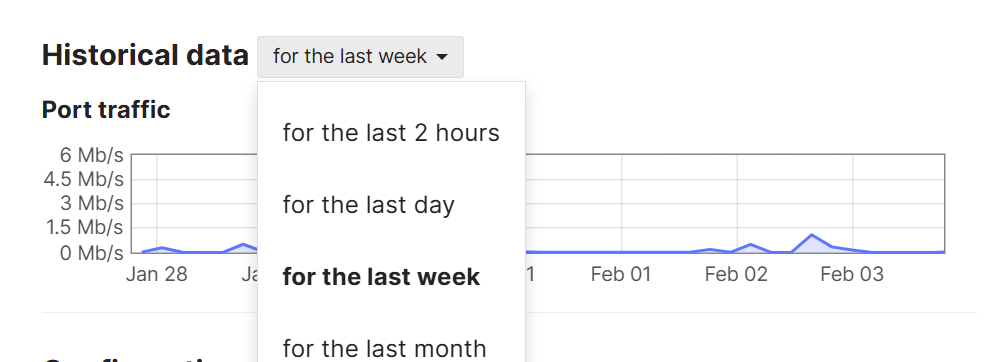
Overview of Specific Switchport Configuration
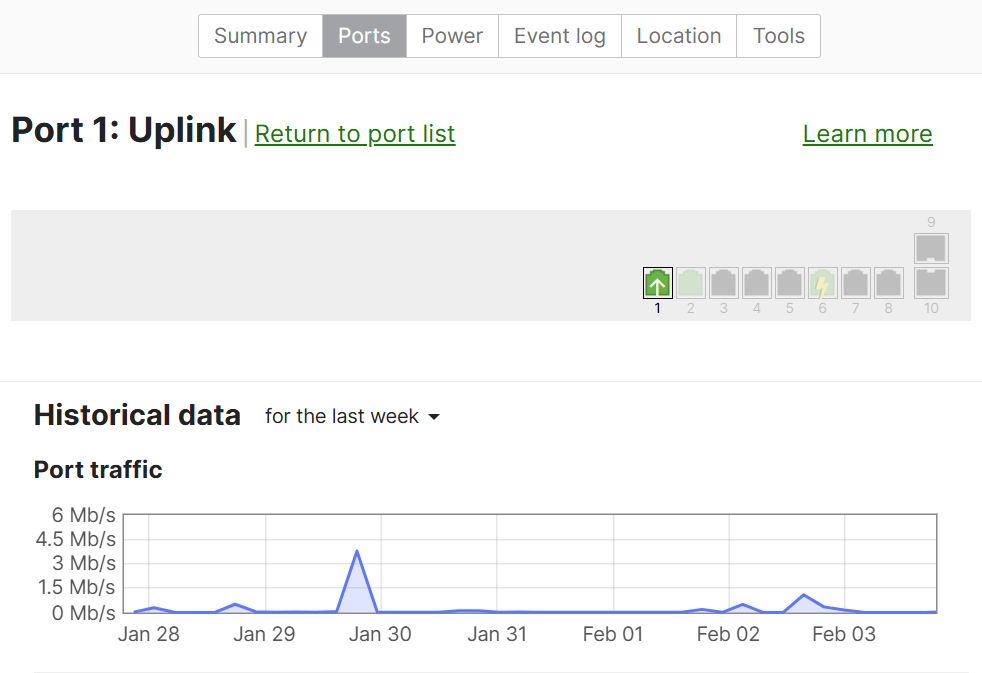
Overview of Specific Switchport Configuration
Overview of Specific Switchport Configuration
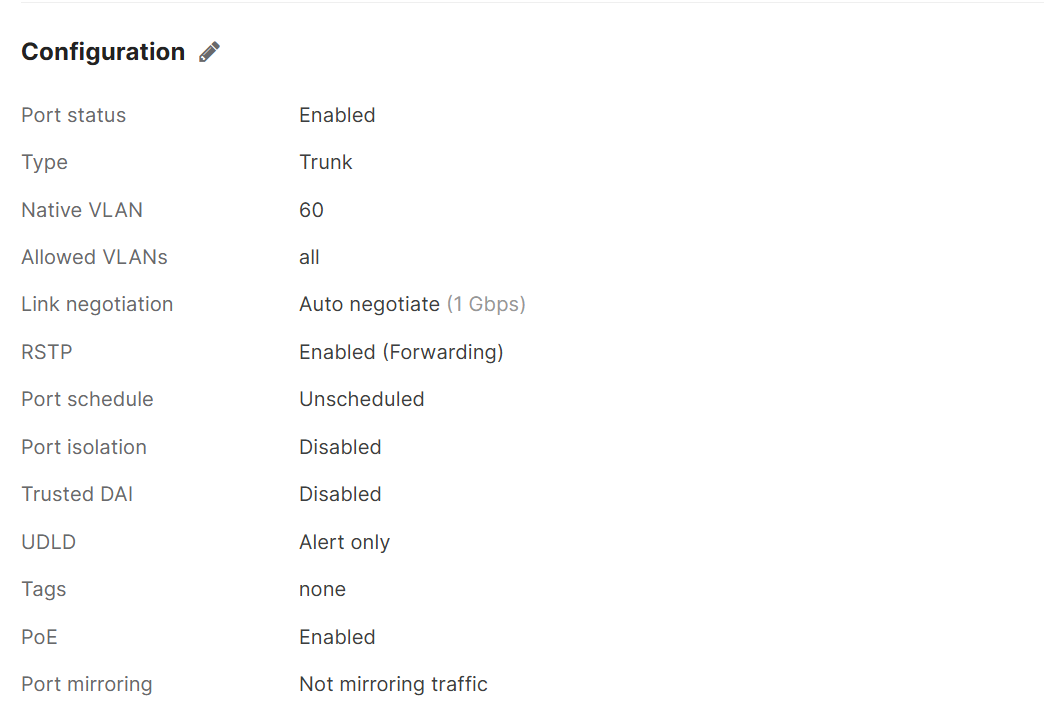
Overview of Specific Switchport Configuration
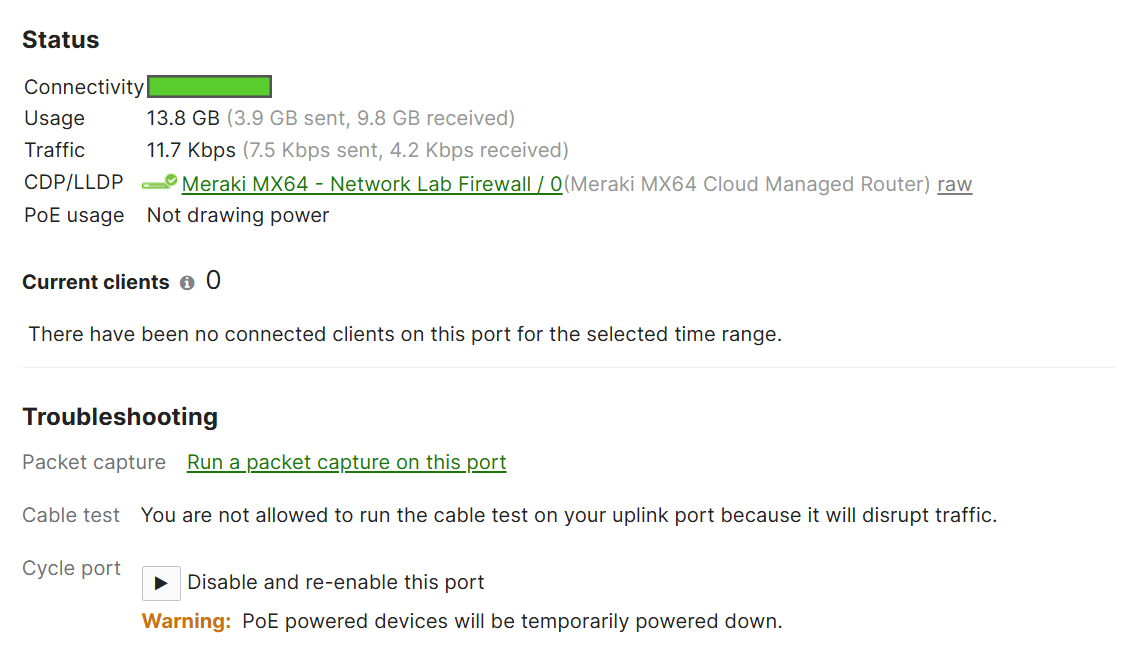
Overview of Specific Switchport Configuration
Monitoring Switches: Power
Overview:
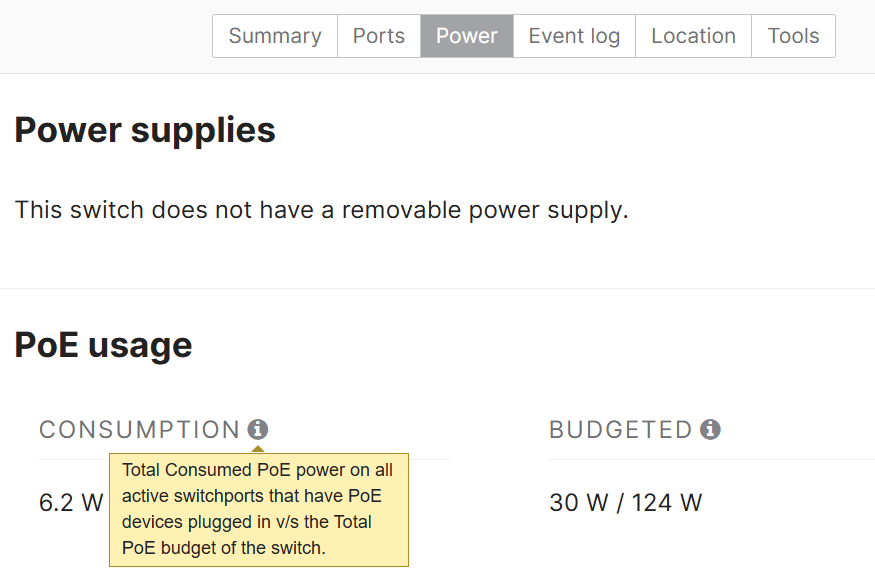
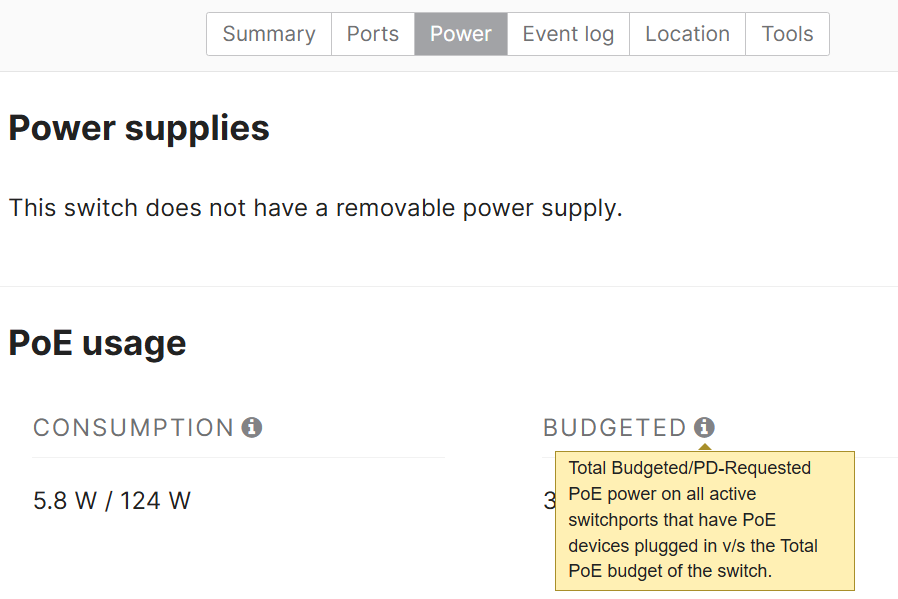
- The Switches Power page is a section of the Meraki Dashboard dedicated to monitoring the PoE usage and power supplies on the switch
- This page provides insights into the power consumption of connected PoE enabled devices such as IP phones, wireless access points, and cameras
Power Menu Overview:
Monitoring Switches: Event Log
Overview:
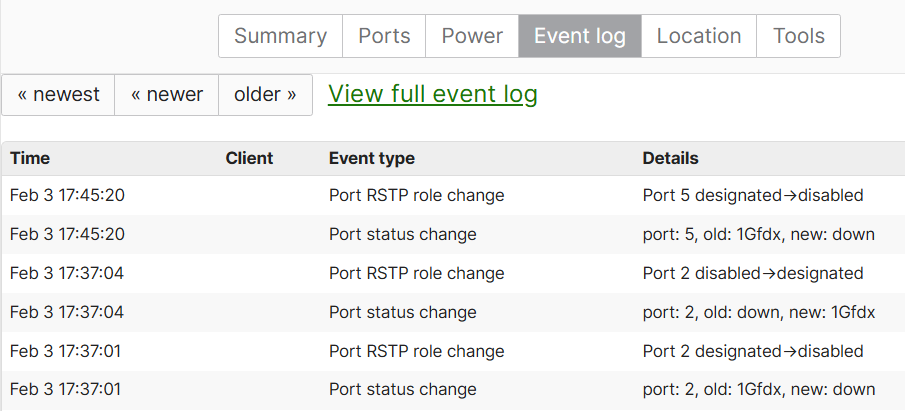
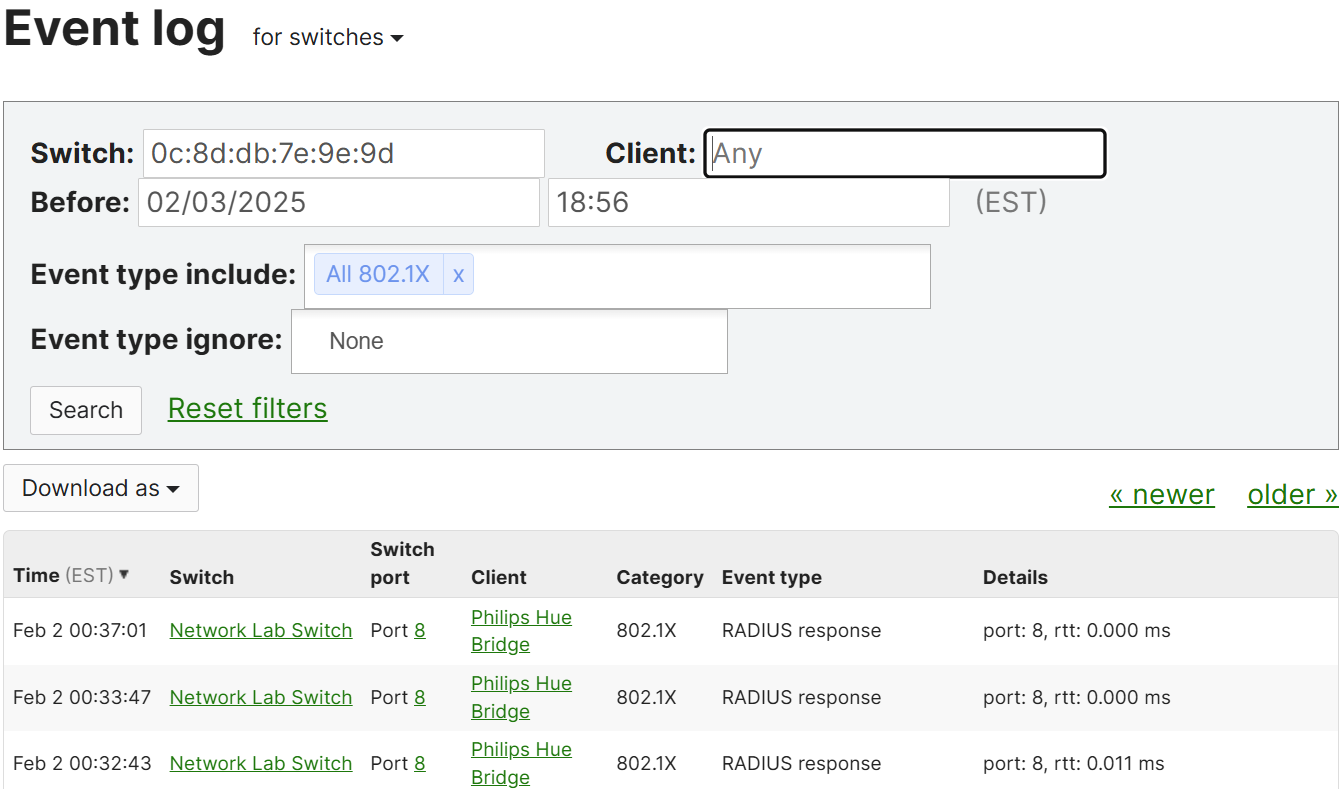
- The Switches Event Log page provides a comprehensive view of all the system events and alerts related to the switch or switches and its connected devices
- This page alongside the global network view of the Event Log logs activities, status changes, error messages, configuration changes, and other important network events in real time, which can help admins monitor the health and performance of network devices
- If a network problem arises (e.g., a port goes down or a device disconnects), the Event Log can help pinpoint the cause and the timestamp of the event, speeding up troubleshooting
Event Log Menu Overview:
Local Switch Event Log
Global Switch Event Log
Monitoring Switches: Location
Overview:
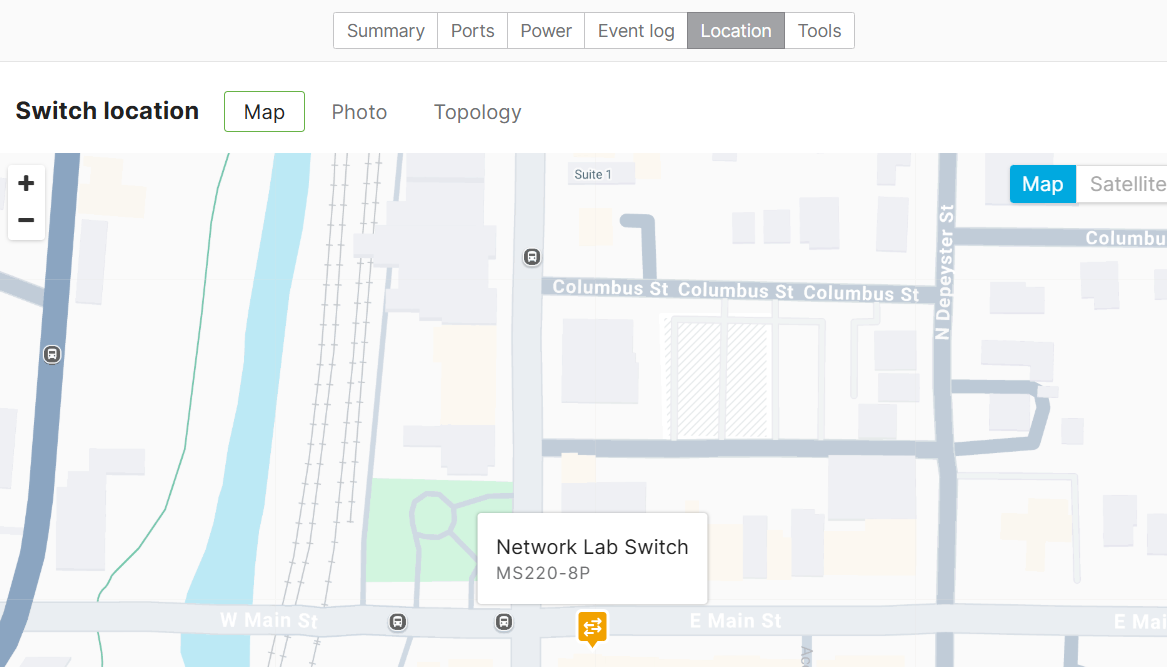
- The monitoring Switches Location page allows admins to assign physical locations to network devices such as switches
- This page is useful in large networks with multiple switches spread across different physical locations, such as different floors of a building, multiple campuses, or remote offices
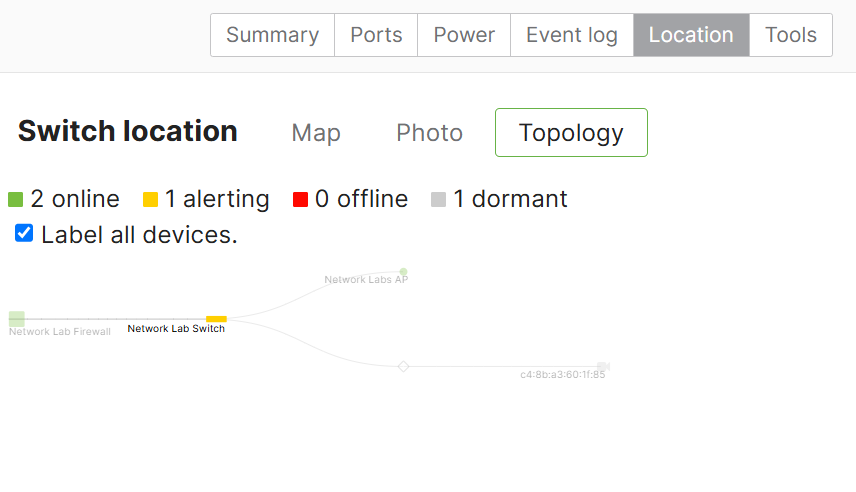
- The Topology section provides a visual representation of the network's logical structure allowing admins to see how Meraki devices including switches, access points, and other network equipment, are interconnected and organized within the network
- The Topology section can also help with network monitoring, troubleshooting, and management by offering a high level overview of device connections and their relationships to each other
Location Menu Overview:
Map View
Map View
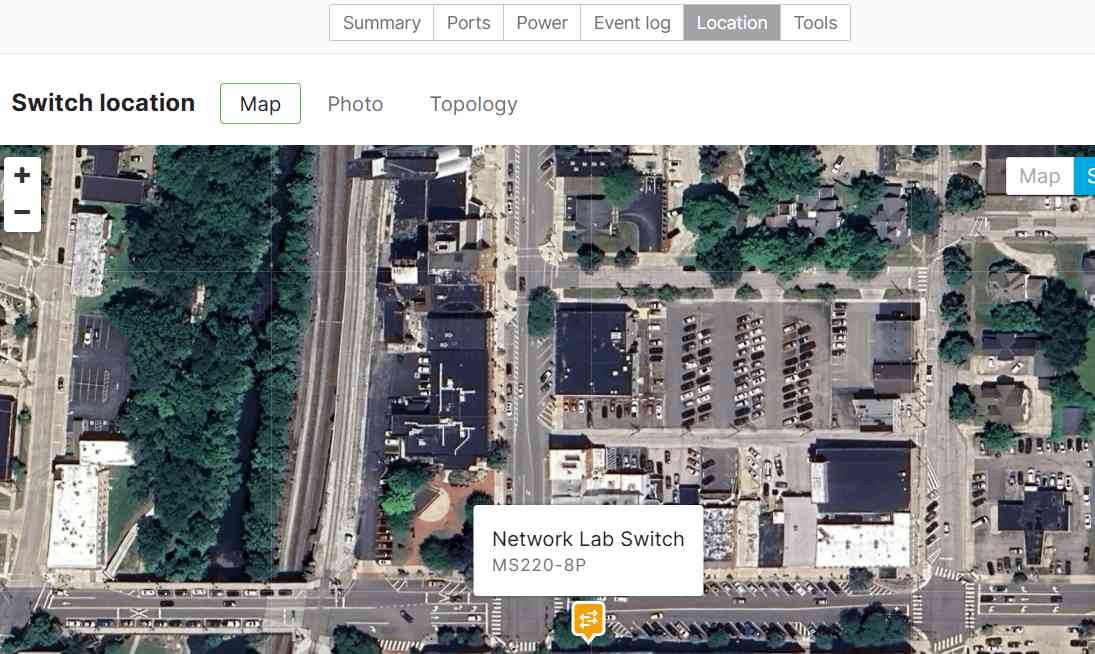
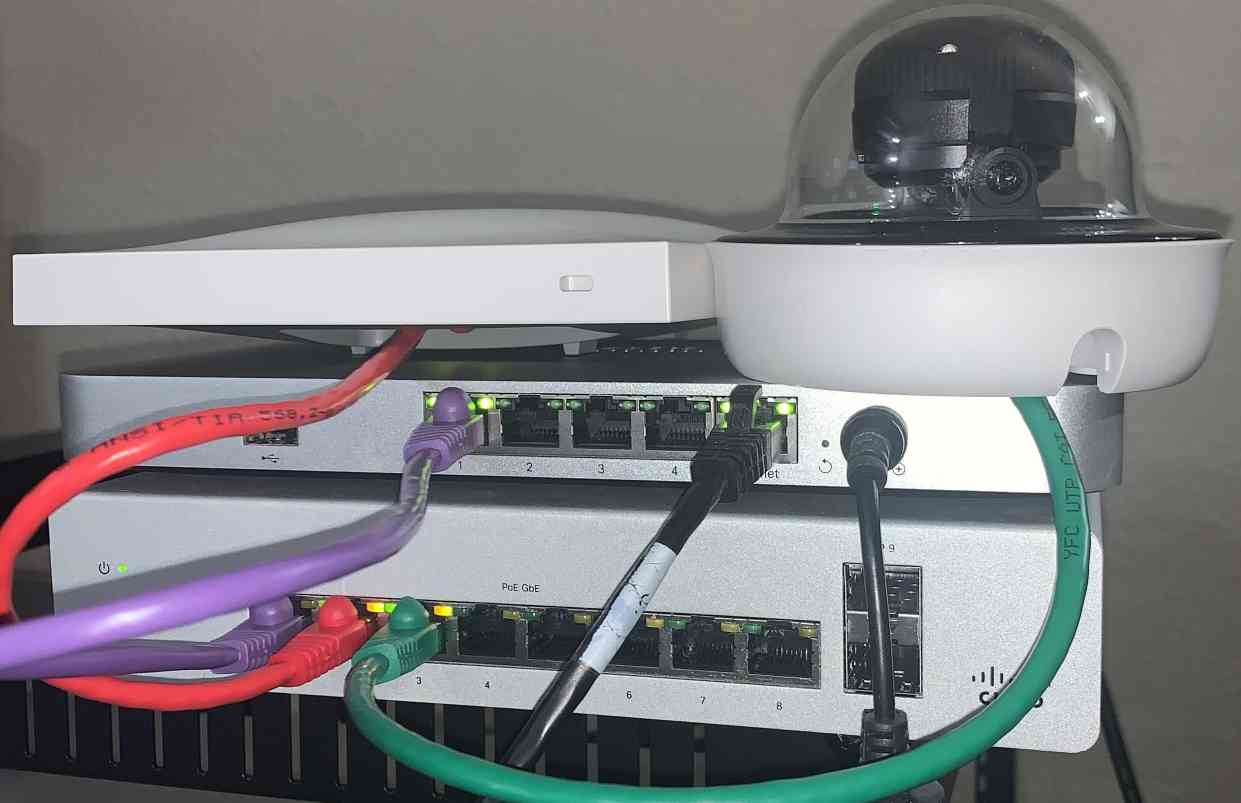
Photo View

Topology View
Monitoring Switches: Tools
Overview:
- The monitoring Switches Tools page provides a set of diagnostic and management tools to help admins troubleshoot and configure the network
- In this section, I will demonstrate a use case for each diagnostic tool offered by Meraki
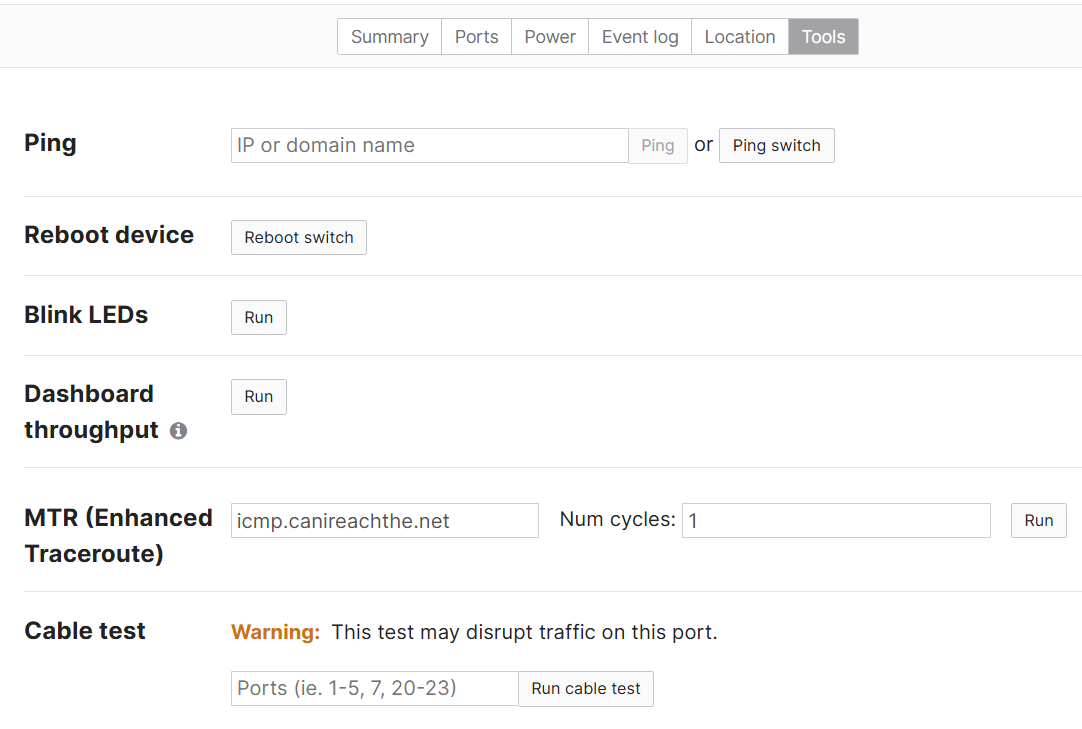
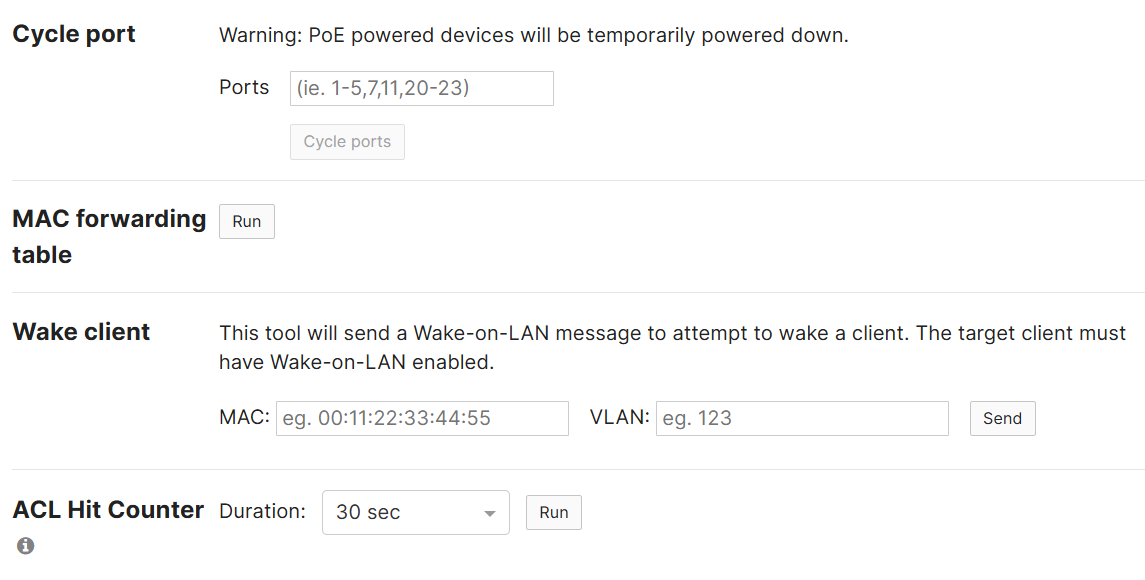
Tools Menu Overview:
Cable Test
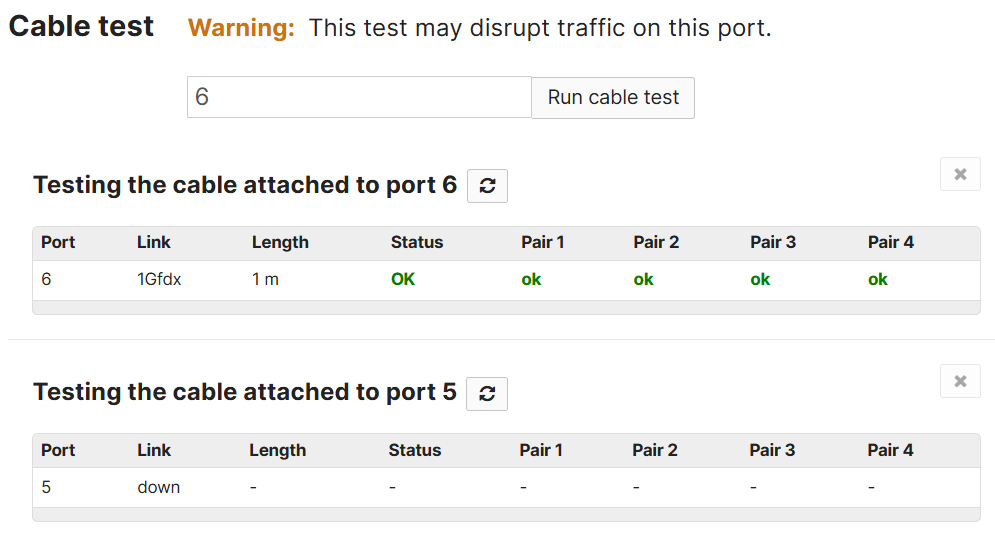
Cable Test
Use Case
- If a device connected to a port isn't functioning, you can run a cable test to check for wiring issues or faults in the Ethernet cable. This helps eliminate the possibility of a physical connection problem at layer 1 of the OSI model
Important Cisco Notices
- Use of this test can disrupt traffic on 10 or 100 Mbps links - gigabit links will not be affected
- This tool is intended for testing copper twisted-pair cabling. It is not intended for use with fiber-optic cabling
- Make sure the cable is connected to devices at both ends, before running the test
MAC Forwarding Table
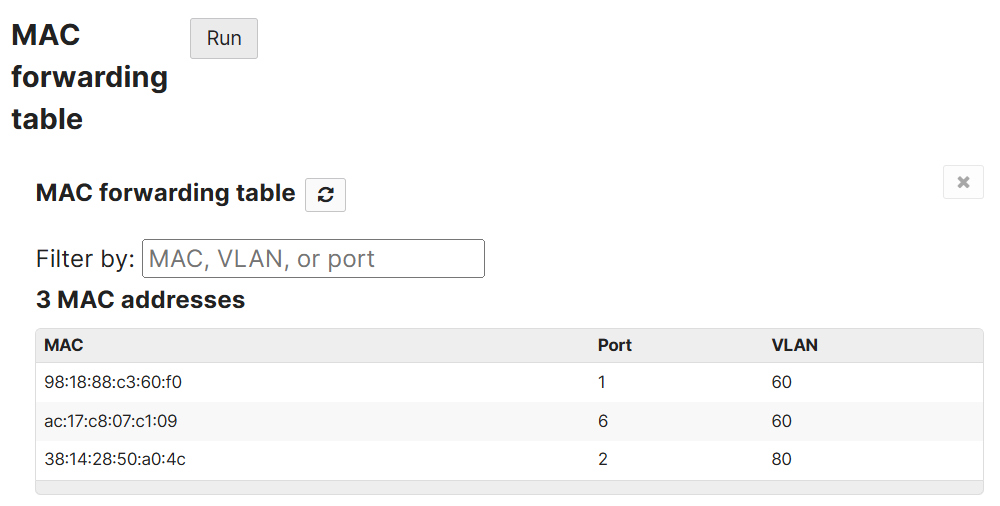
MAC Forwarding Table
Use Case
- This tool helps troubleshoot network issues by allowing admins to verify if a device is connected to the expected port
- If there are connectivity issues or performance problems, the MAC forwarding table allows you to confirm whether the switch is correctly learning the MAC addresses of connected devices
- This tool incorporates a search bar, which can be used to filter for a specific mapping
Dashboard Throughput
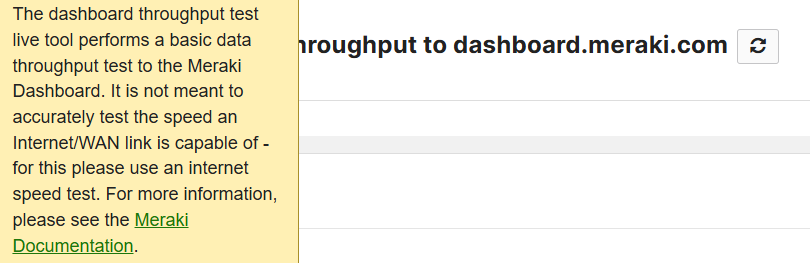
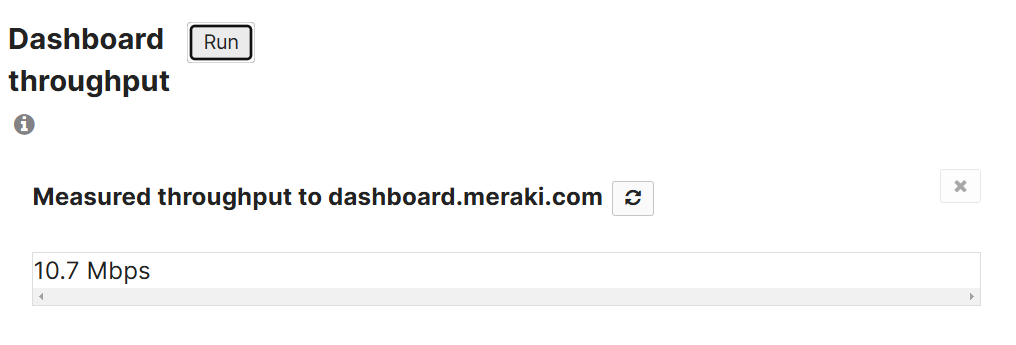
Dashboard Throughput
Use Case
- This tool will determine the approximate throughput between the device and the Cisco Meraki Cloud Controller
- Per Cisco, this tool can be used to get a general idea of throughput for upstream traffic from this device, which can be helpful in the event of a suspected bandwidth issue
Important Cisco Notices
- Reported speeds may be less than actual speeds, as the test will be affected by other switch behaviors and functions. For a more accurate throughput test between two nodes, please use iperf or another throughput test
Ping
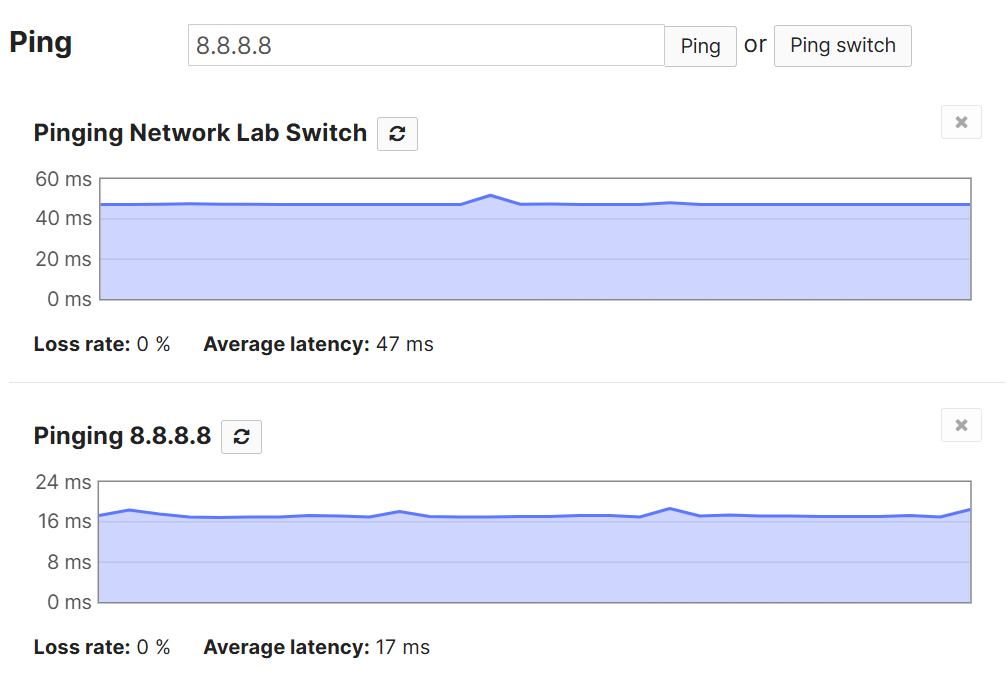
Ping
Use Case
- The Ping test can ensure connectivity between the switch and a specified destination. If the destination is unreachable, this can help narrow down the issue to a routing problem or a potential device failure
Important Cisco Notices
- If the MS switch/stack is only configured for Layer 2 switching, then pings will be sourced from the MS management interface
- If the MS switch/stack has a Layer 3 routing configuration, then pings will be sourced from the Layer 3 interface specified in the drop down
MTR Traceroute
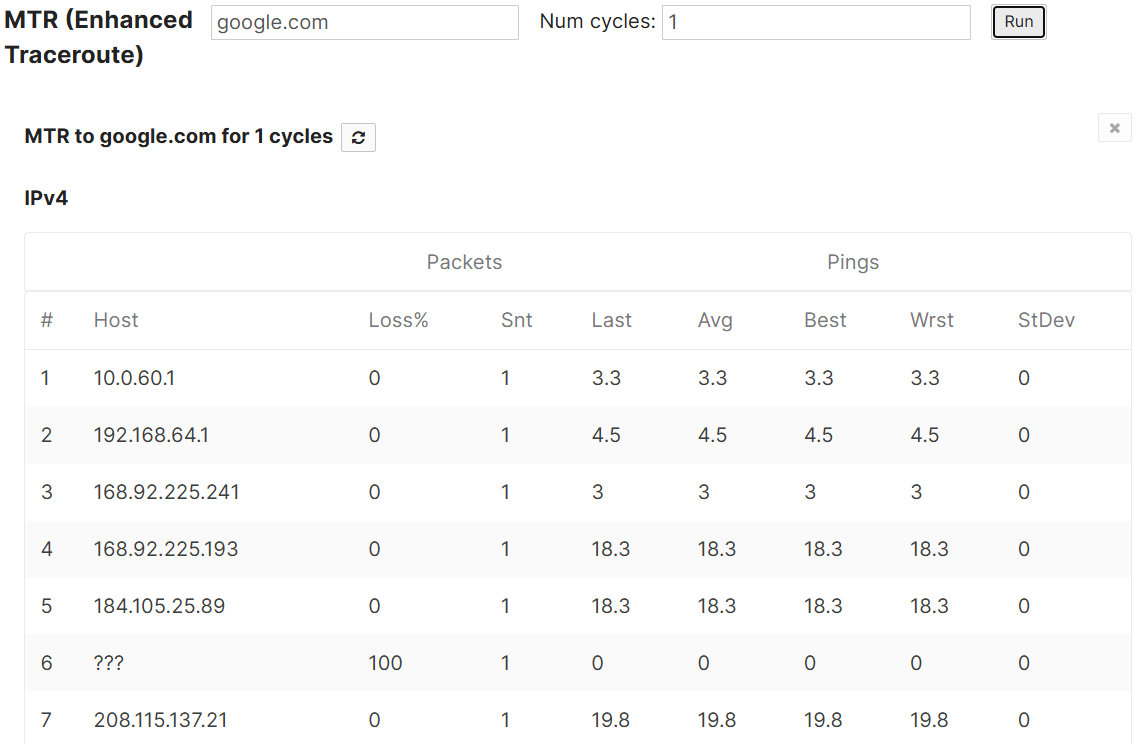
MTR Traceroute
Use Case
- With the Traceroute test, if there are network latency issues occurring, a traceroute can help identify where the delays are occurring whether it's a specific router or switch in the path to the destination
Important Cisco Notices
- This is commonly utilized for identifying potential causes for loss or delays to a destination from the MS'LAN IP. This destination may be a FQDN or IP address
- Traditional Traceroute tool is only available when L3 interfaces have been configured on the switch
Cycle Port
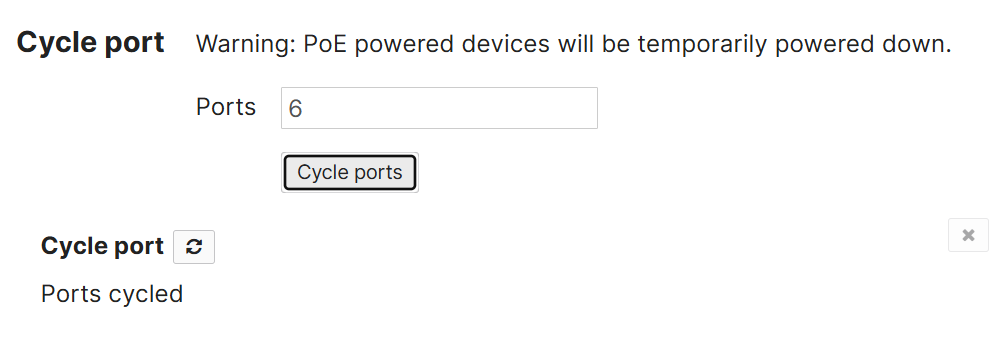
Cycle Port
Use Case
- This tool allows admins to reset or power cycle a specific port on a switch
- This tool can be useful for troubleshooting network issues, especially when a device connected to a particular switch port becomes unresponsive or is having connectivity issues
Important Cisco Notices
- This tool allows admins to specify multiple port numbers separated by commas or a range of ports
- This can be a useful to remotely reboot a connected PoE powered device such as a VoIP phone or access point
ACL Hit Counter
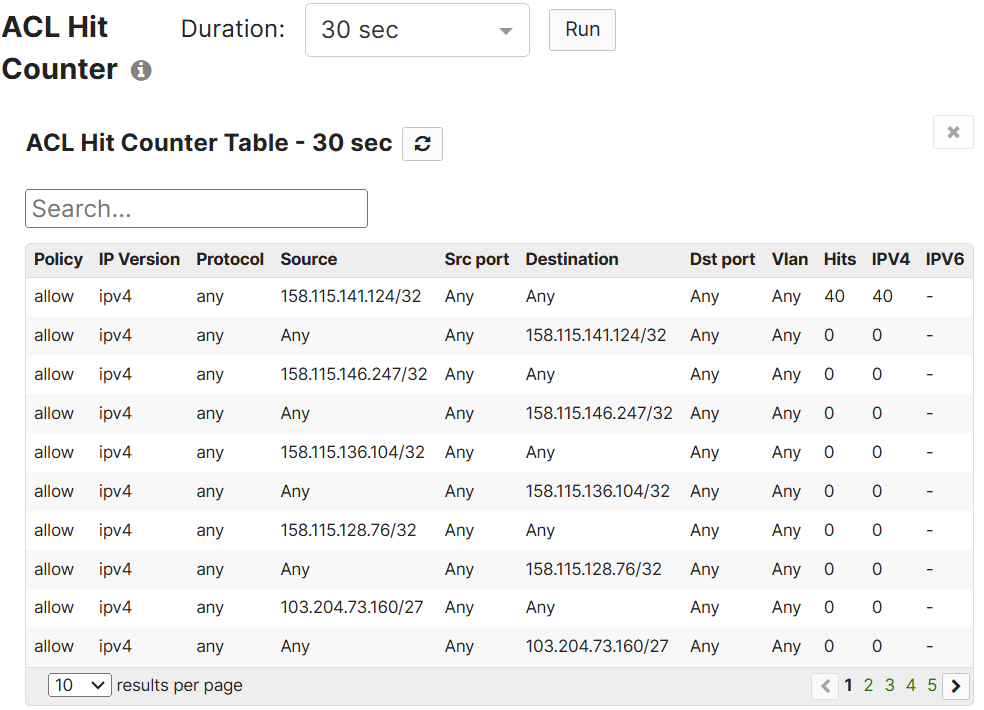
ACL Hit Counter
Use Case
- This tool allows admins to monitor and track the effectiveness of Access Control Lists (ACLs) on a switch
- This tool can be useful for confirming that traffic is being denied or allowed as expected, or that hosts on the network are indeed sending the type of traffic admins expect
Important Cisco Notices
- This tool can be run for 30 seconds, 1 minute, or 2 minutes, during which time the ACEs defined in the network-wide 'Switching >> ACL' page will be displayed under the tool along with the hit counts indicating how many frames have matched the ACEs while the live tool is running
Reboot Switch
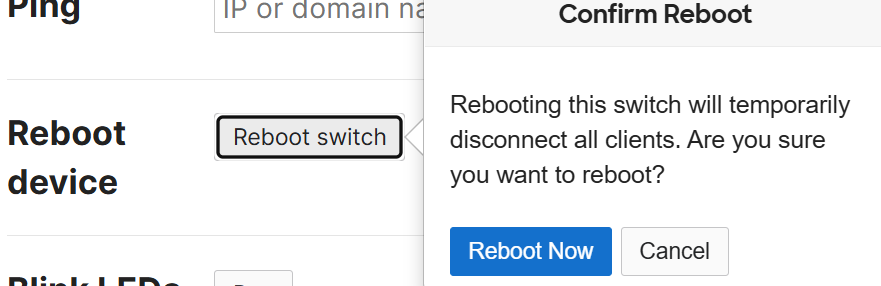
Reboot Switch
Use Case
- Rebooting a switch remotely is a simple and fast solution for resolving many common switch issues such as stuck processes, network errors, or software glitches, without needing to be physically present
Important Cisco Notices
- This tool will temporarily disconnect all clients, so it is advised only to reboot the device during scheduled maintenance hours or in the event of an emergency
- Because the reboot is only a soft reboot, it will retain its current configuration upon rebooting
Blink LEDs

Blink LEDs
Use Case
- This tool will cause all LEDs on this switch to blink. This can be a quick way to identify an unlabeled switch in a rack
Wake Client
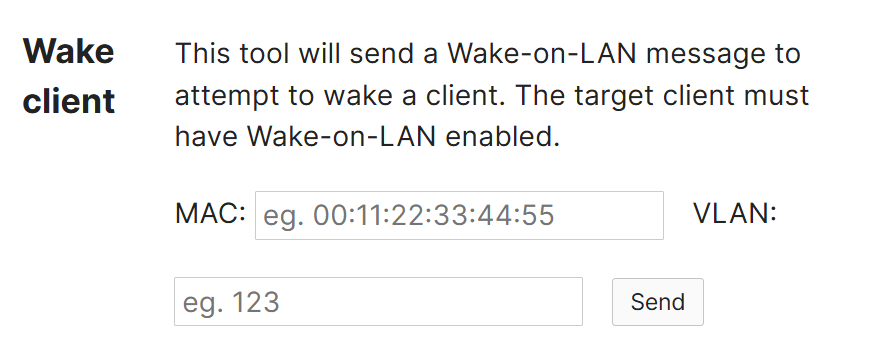
Wake Client
Use Case
- This tool allows admins to remotely wake up a computer or device that is in the powered off state or in sleep mode
- This tool is useful for scenarios where remote management or maintenance is needed, but the target device is powered down or in a low power state
Important Cisco Notices
- If a client machine has been configured with Wake-on-LAN, an admin can specify that host's MAC address to send a magic packet and wake the host machine
- An admin can also specify a VLAN, and broadcast a magic packet out on that VLAN. This tool can be useful in a network environment that utilizes Wake-on-LAN for remote power management
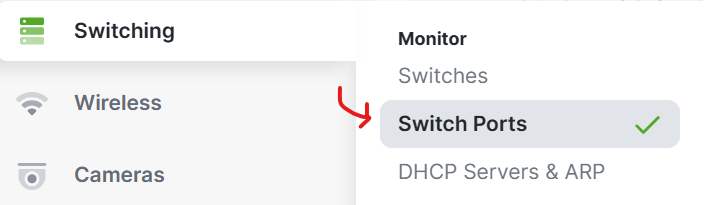
Monitoring Switchports
Overview:
- The monitoring Switch Ports page provides an overview of the individual Ethernet ports on a Meraki switch. It allows network admins to monitor, configure, and manage the behavior of each port on the switch
- This page gives detailed information about each port's status, configuration, and performance, enabling network admins to effectively monitor and troubleshoot network connections and ensure smooth operation
- In this section, I will demonstrate the available switchport tools offered by Meraki
Monitoring Switchports Menu
Switchports Menu Overview:
Summary Overview
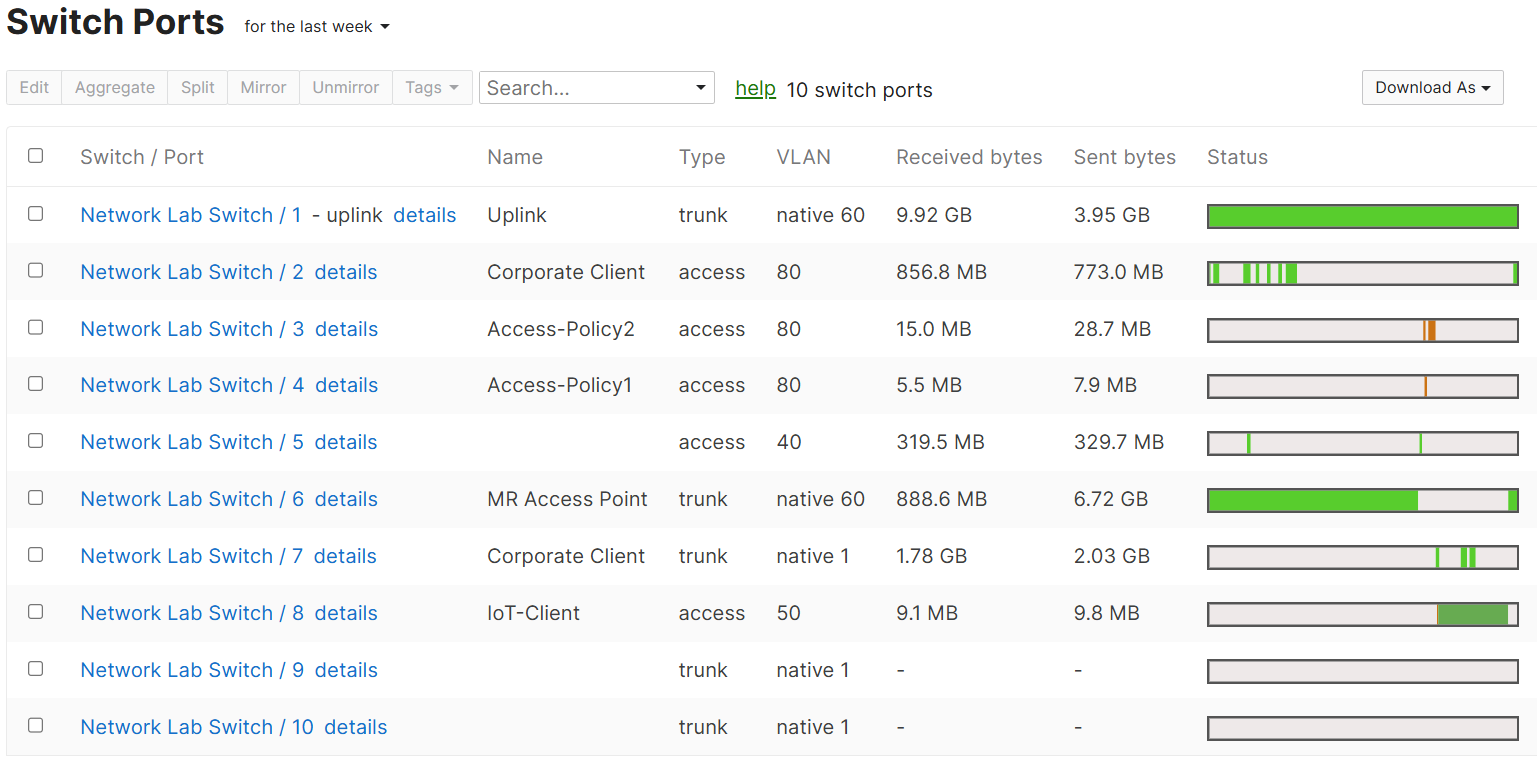
Summary Overview
Use Case
- The summary page allows admins to search for specific Ethernet ports across their Meraki switch infrastructure. This page helps simplify the process of locating and managing individual switch ports
Important Cisco Notices
- Use conditional operators to separate multiple serach queries (AND, OR)
- Use a wildcard to search for more general results (*)
- Use a dash to exclude a search value (-)
- Enter specific search terms to find a particular port
Exporting to Excel
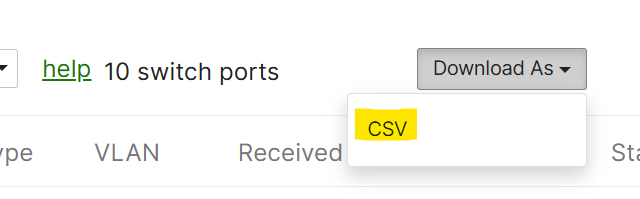
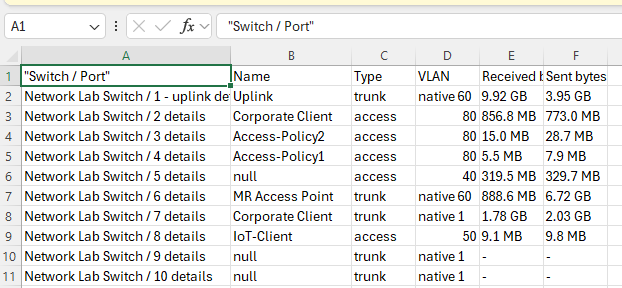
Exporting to Excel
Use Case
- Meraki offers an export to Excel function that allows admins to export detailed information about the switch ports
- This is useful for reporting, documentation, or offline analysis of the port configurations and status across Meraki switches
Exported Fields
- Name
- Type
- VLAN
- Received Bytes
- Sent Bytes
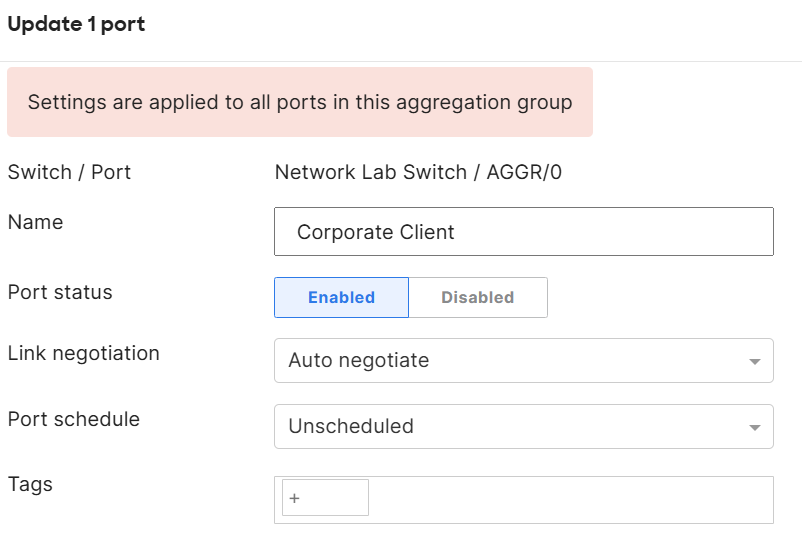
Editing Ports
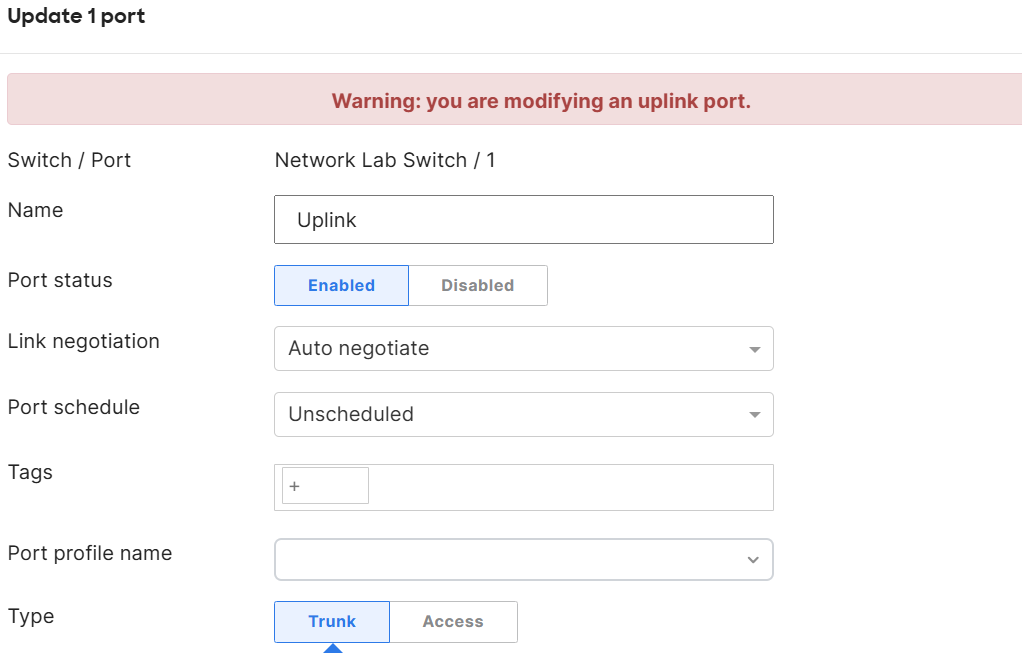
Editing Ports
Use Case
- Meraki's MS switches allow for the configuration of a single or multiple ports, centrally managed via the Meraki Dashboard
Port Configuration Fields
- Name: Description of the port
- Port Status: Enable/Disable the port
- Link Negotiation: Select the desired link speed
- Port Schedule: Apply a port schedule policy
- Tags: Labels that can be used to identify this port or a group of ports
- Port Profile Name: Apply a port profile policy
- Type
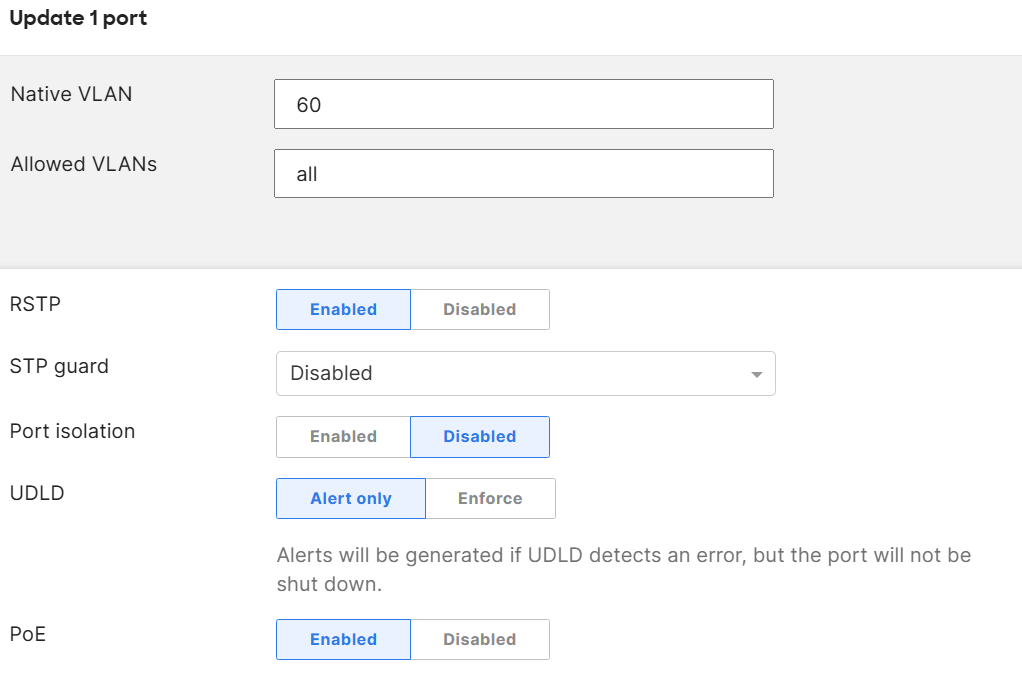
- Trunk:
- Native VLAN: All untagged traffic will be placed on this VLAN
- Allowed VLANs: Only these VLANs will be able to traverse this link
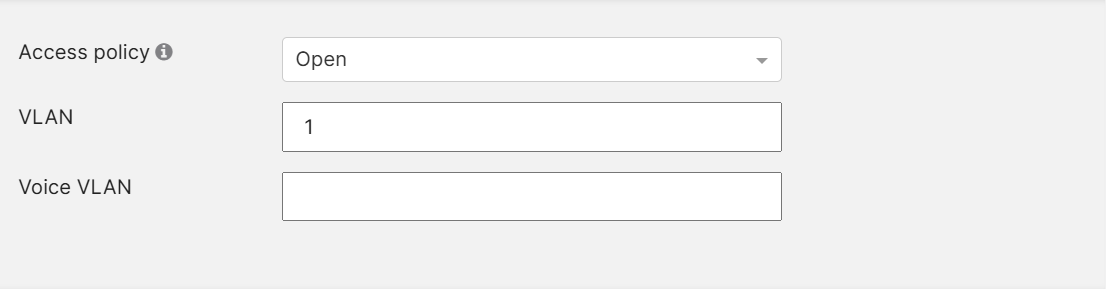
- Access:
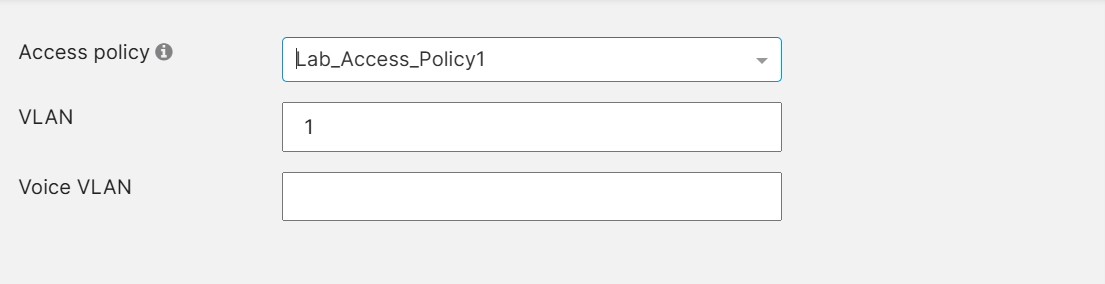
- Access Policy
- Open: All devices will be able to access this port
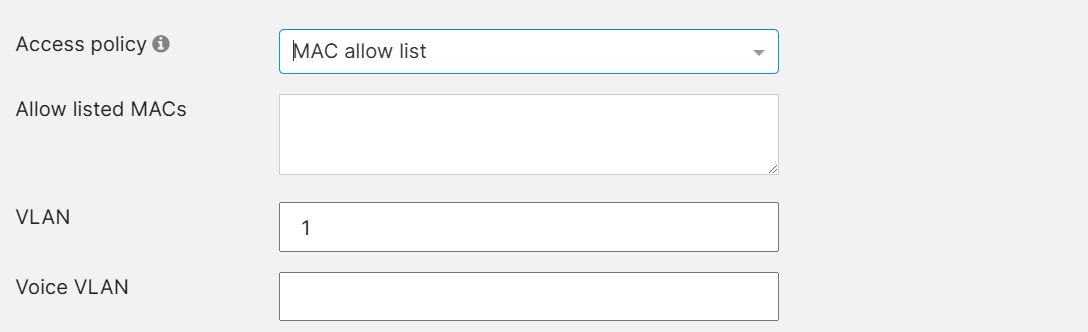
- MAC Allow List: MAC allow list allows users to enter up to 20 MAC addresses they want to be permitted to pass traffic on a particular port, restricting traffic on that port to the configured MAC addresses only
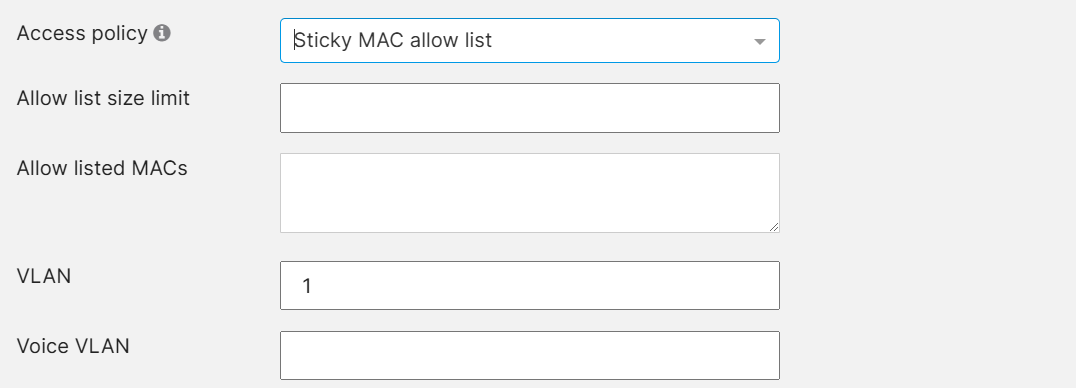
- Sticky MAC Allow List: Similar to MAC Allow List, Sticky MAC also allows MAC addresses to be dynamically learned on a port. Users can either program the allowed MAC addresses statically into the Allowed listed MACs list, or allow for the switchport to dynamically learn the MACs
- VLAN: Apply a VLAN to an access port
- Voice VLAN: Apply a Voice VLAN to an access port
- Access Policy
- Trunk:
- RSTP: Enable/Disable RSTP Spanning Tree
- STP Guard:
- Root Guard: Root Guard protects the current Root Bridge from receiving superior BPDUs from other downstream switches
- BPDU Guard: Recommended to apply to all access ports that are not intended to be connected to a neighboring switch
- Loop Guard: Loop Guard is used to protect a network from unidirectional loops
- Port Isolation: Enabling this feature prevents any isolated port from communicating with other isolated ports
- UDLD: Alert/Enforce Unidirectional Link Detection on the port
- PoE: Available on PoE switches only. Enable/Disable PoE on this port
- Stacking: Enable flexible stacking on this port
- Trusted DAI: Enable/Disable the trusted status for Dynamic ARP Inspection
Port Mirroring
Port Mirroring
Use Case
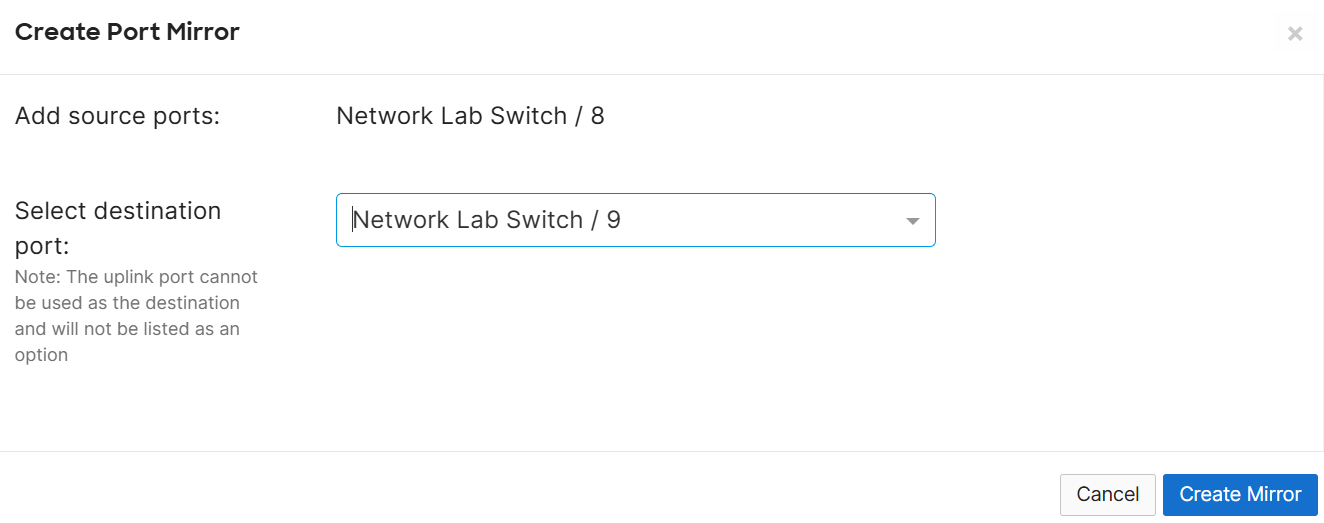
- Meraki offers a port mirroring or SPAN solution for Meraki switches, allowing for network troubleshooting, monitoring, and analysis
- Port mirroring is a technique used to send a copy of network traffic from one port (or multiple ports) to another port, where a monitoring device (such as a network analyzer or sniffer) can capture and analyze that traffic
Important Cisco Notices
- MS switches support one-to-one or many-to-one mirror sessions
- Only one active destination port can be configured per switch/stack
LACP Aggregation
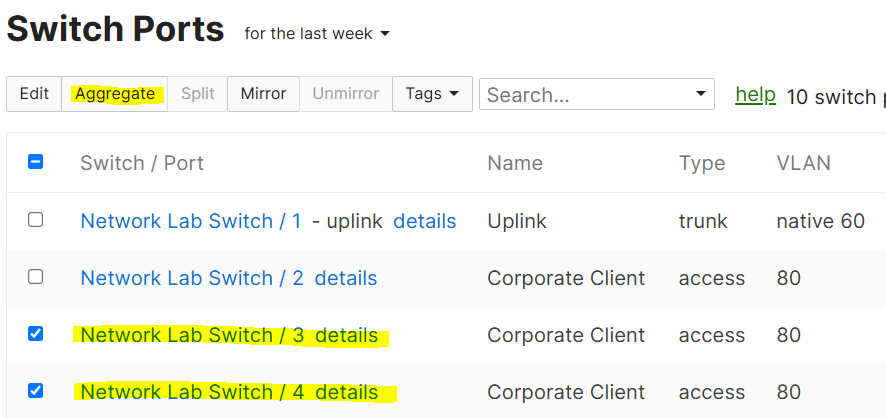
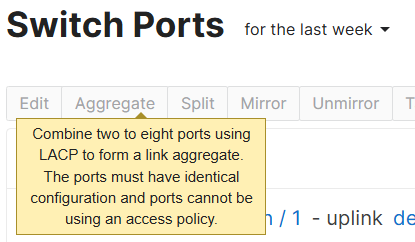
LACP Aggregation
Use Case
- The Aggregation feature for switchports allows admins to configure and manage LACP Link Aggregation for switches
- By aggregating multiple links into a single logical connection, LACP enables higher data throughput between switches or network devices. This is especially useful in high-traffic environments where single links may not provide enough bandwidth
- LACP also ensures that if one link in an aggregation group fails, the other links can continue carrying traffic, providing network redundancy and minimizing risk of downtime
Important Cisco Notices
- It is generally recommended that ports are first aggregated and then physically connect the aggregated ports. Be sure to configure the aggregate (or have LACP enabled) on both ends of the link. Configure the downlink device first, wait for the config to state up to date, before configuring the aggregation (uplink) device. If the process is performed in the uplink side first, there may be an outage depending on the models of switches used. For c9300-M/MS390s, the process described must be followed to ensure the aggregation forms correctly
- The MS switches support LACP groups of up to 8 ports on the same switch or physical stack
- Make sure both switchports share the same configuration, including tags, prior to aggregating
- Link Aggregation is supported on ports sharing similar characteristics such as link speed and media-type (SFP/Copper)
- When configuring LACP between Meraki MS and Catalyst, it may be advantageous on the Catalyst switch to disable the feature "spanning-tree etherchannel guard misconfig" if there are issues with getting the LACP aggregate established
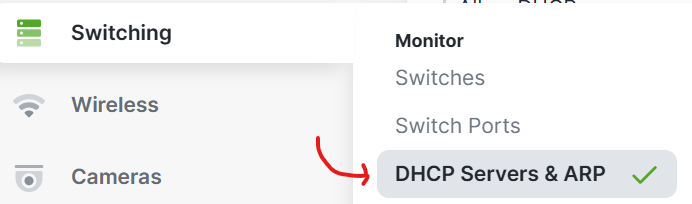
Monitoring DHCP Servers & ARP
Overview:
- The monitoring DHCP Servers & ARP page displays information about any IPv4 and IPv6 DHCP servers and IPv6 Router Advertisements seen by Meraki switches on the LAN
- From this page, admins can configure the MS switches in the network to allow or block DHCP or Router Advertisement messages from specific devices
- DAI or Dynamic ARP Inspection can also be enabled globally from this page, a security feature in MS switches that protects networks against main-in-the-middle ARP spoofing attacks
Monitoring DHCP Servers & ARP Menu
DHCP Servers & ARP Menu Overview:
Default DHCP Servers Policy & Blocking
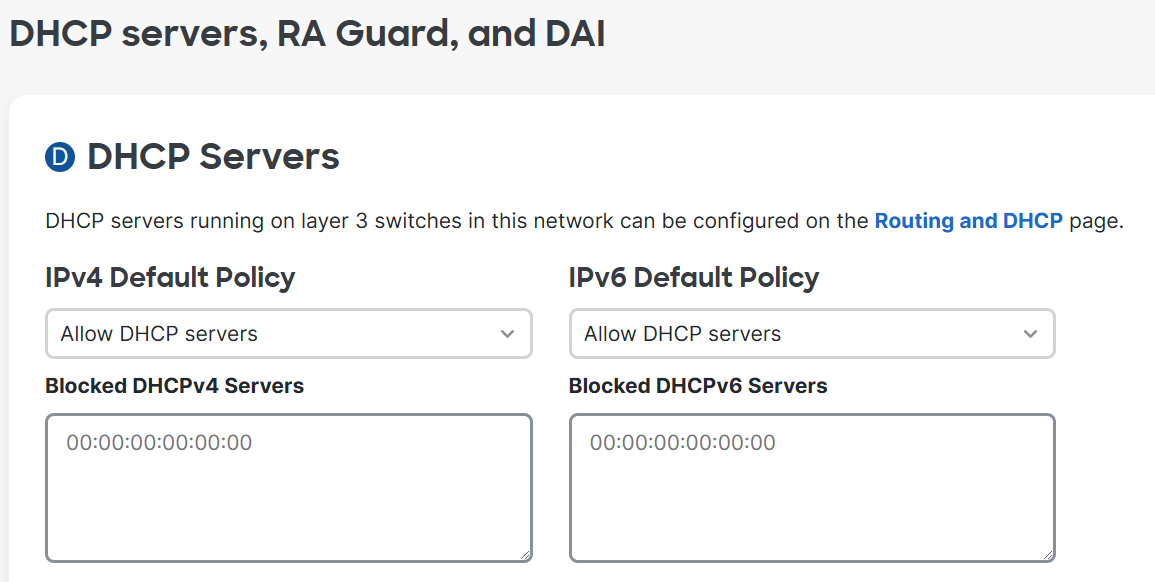
Default DHCP Servers Policy & Blocking
Default DHCP Servers Policy
- Per Cisco, the default policy is set to allow DHCP servers on the network
Blocking DHCP Servers
- When the default policy is set to Allow, DHCP servers can be explicitly blocked by entering the MAC address of the server in question
- When the default policy is set to Block DHCP Servers, the Blocked DHCP Servers section changes to Allowed DHCP Servers, and the MAC address of any servers which should be allowed to send DHCP traffic through the switches should be listed in this section
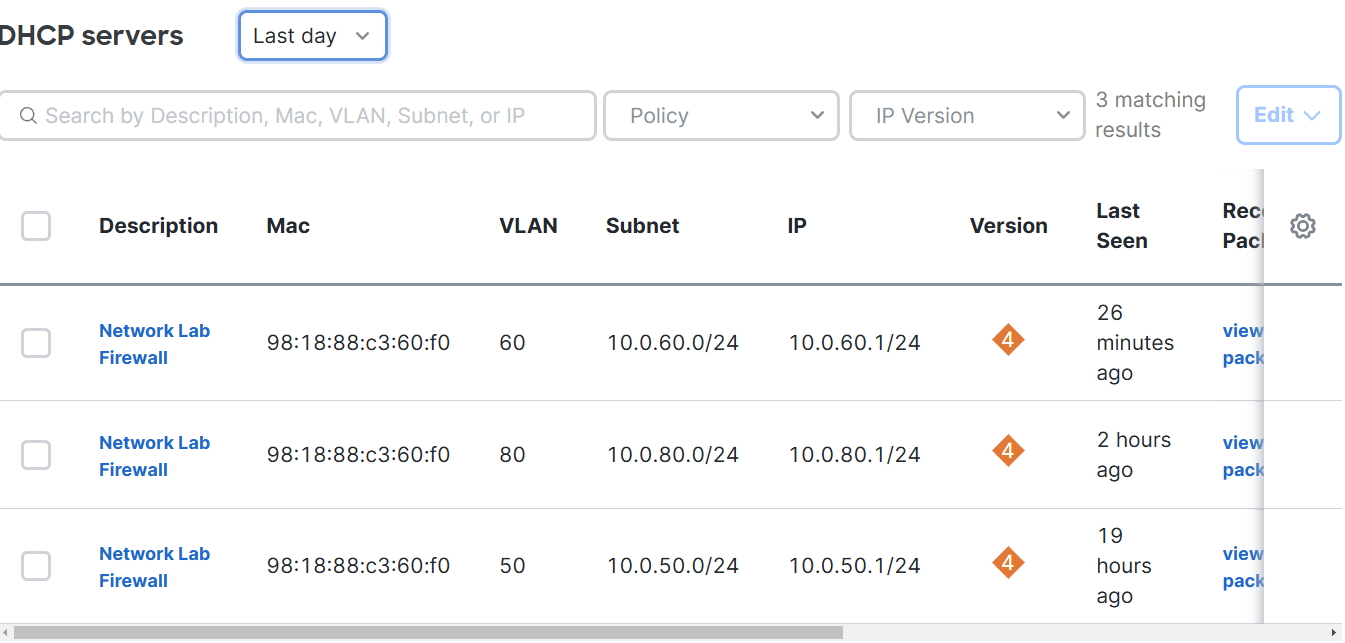
Detected DHCP Servers
- The DHCP servers list displays any clients on the network that have been observed sending DHCP responses
- The table can display servers that have been detected in the last 2 hours, last day, last week, or last 30 days
Default RA Guard Policy
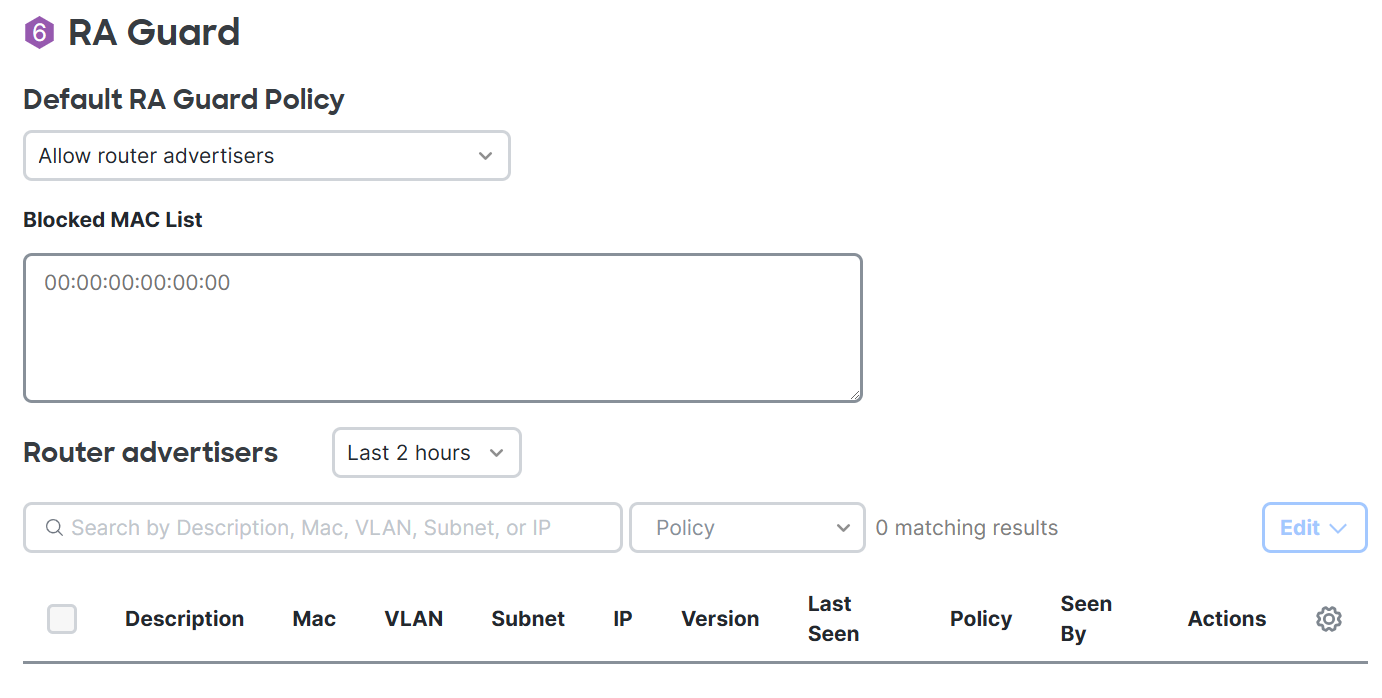
Default RA Guard Policy
Default RA Guard Policy
- Per Cisco, the default policy is set to allow all router advertisements on the network
- When the default policy is set to Block router advertisers, the Blocked MAC list section changes to Allowed MAC list, and the MAC address of any routers which should be allowed to send router advertisements through the switches should be listed in this section
Detected Router Advertisers
- This section of the page is also populated with a Routers advertisers list when any devices on the network have been observed sending Router Advertisements
- This table can display devices that have been detected in the last 2 hours, last day, last week, or last 30 days
Dynamic ARP Inspection
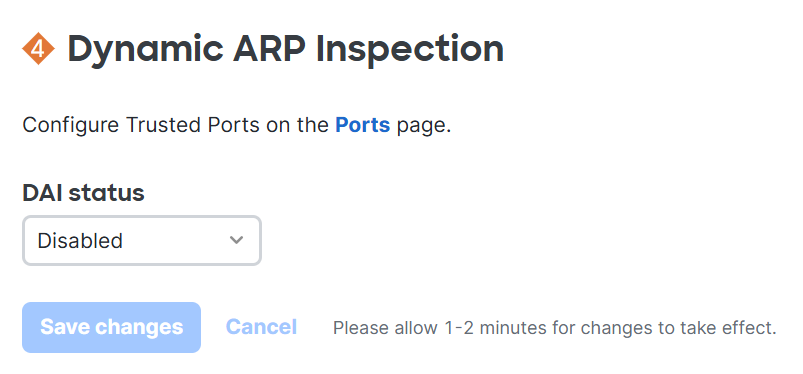
Dynamic ARP Inspection
Default DAI Policy
- Per Cisco, the default policy is set to disabled and can be enabled for switches that support DAI
- Upon enabling DAI globally on the switch, trusted ports can be configured on individual switchports from the monitoring switchports page
- DAI relies on the DHCP snooping table information to perform validation. If a switch does not have a corresponding entry in its DHCP Snooping table, and an ARP packet arrives on an untrusted port, DAI validation will fail and the ARP packet will be dropped. It is therefore recommended to use DAI only for DHCP enabled subnets